Figure 5.

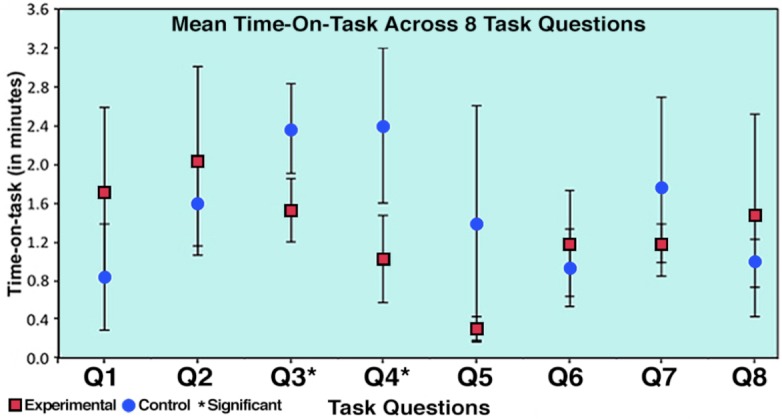
Illustrates significant difference of time-on-task data between the control and experimental groups based on eight scenario questions. See eight task questions in Appendix.

Illustrates significant difference of time-on-task data between the control and experimental groups based on eight scenario questions. See eight task questions in Appendix.