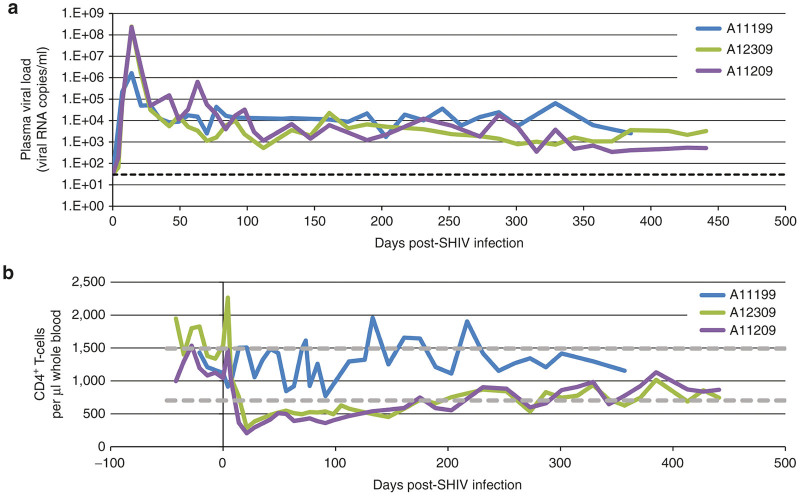
Figure 4.
Plasma viral loads and CD4+ T-cell dynamics in Cal-1-transplanted animals following SHIV challenge. At 9–11 months after autologous transplant, animal ID A11199 was challenged with SHIV-1157ipd3N4 (“SHIV-C,” blue bars) and animals A12309 and A11209 were challenged with SHIV 89.6P (green and purple bars, respectively) by the intravenous route. (a) SHIV genomic RNA was measured by quantitative RT-PCR longitudinally in each animal. Dotted line represents 30 copies/ml, the limit of detection of the assay. (b) Longitudinal CD3+CD4+ T-cell measurements were made by flow cytometry. Dotted lines represent range of CD4+ T-cell counts from 26 healthy control animals. SHIV, simian/human immunodeficiency virus; RT-PCR, reverse transcription PCR.

