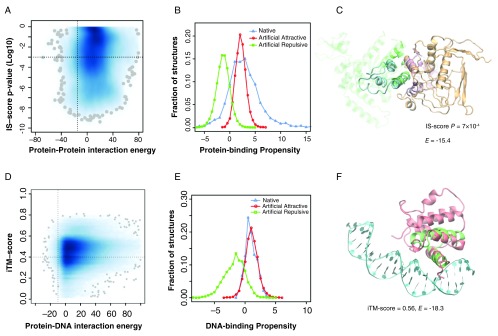
Figure 3. Artificial protein-protein, protein-DNA complexes.
( A) Statistics of putative artificial protein-protein complexes. Joint probability density of interaction energy E PP 43 and the p-value of the interface similarity (IS)-score 42, 44 between an artificial complex and its corresponding native template. Darker blue indicates higher density, with the 100 lowest density spots represented by grey spheres. A vertical/horizontal dashed line is placed at E PP = -15 (a cut-off for high likelihood of interaction) and P = 1×10 -3. ( B) Protein-binding propensity scores (>0 implies favorable binding) of native protein-protein interfaces versus putatively attractive ( E PP <-15) and repulsive ( E PP >10) artificial protein-protein interfaces. ( C) Example of an ART protein-protein complex. The complex was built by superimposing two artificial structures (cyan and orange) onto a native dimeric template (Protein Data Bank [PDB] code 2f4m, chain A and B, colored in green and purple). Interface alignment according to iAlign 42. Both structures are shown in line representations, with the non-interfacial regions of the native template shown in transparent mode for clarity. ( D) Statistics of artificial DNA-protein complexes. Joint probability density of DNA-protein interaction energy, E DP 46, and the interfacial template modeling (TM)-score 22 between an ART protein and its corresponding native template. A vertical/horizontal dashed line is placed at E DP = -10 and iTM-score = 0.4. ( E) DNA-binding propensity scores (>0 implies favorable binding) of native DNA-protein interfaces versus putatively attractive ( E DP <-10) and repulsive ( E DP >10) artificial DNA-protein interfaces. ( F) Example of an artificial DNA-protein complex. The complex was built by superimposing the ART structure (red) onto a native template (PDB code 1akh, the native protein and DNA are colored in green and cyan, respectively).

