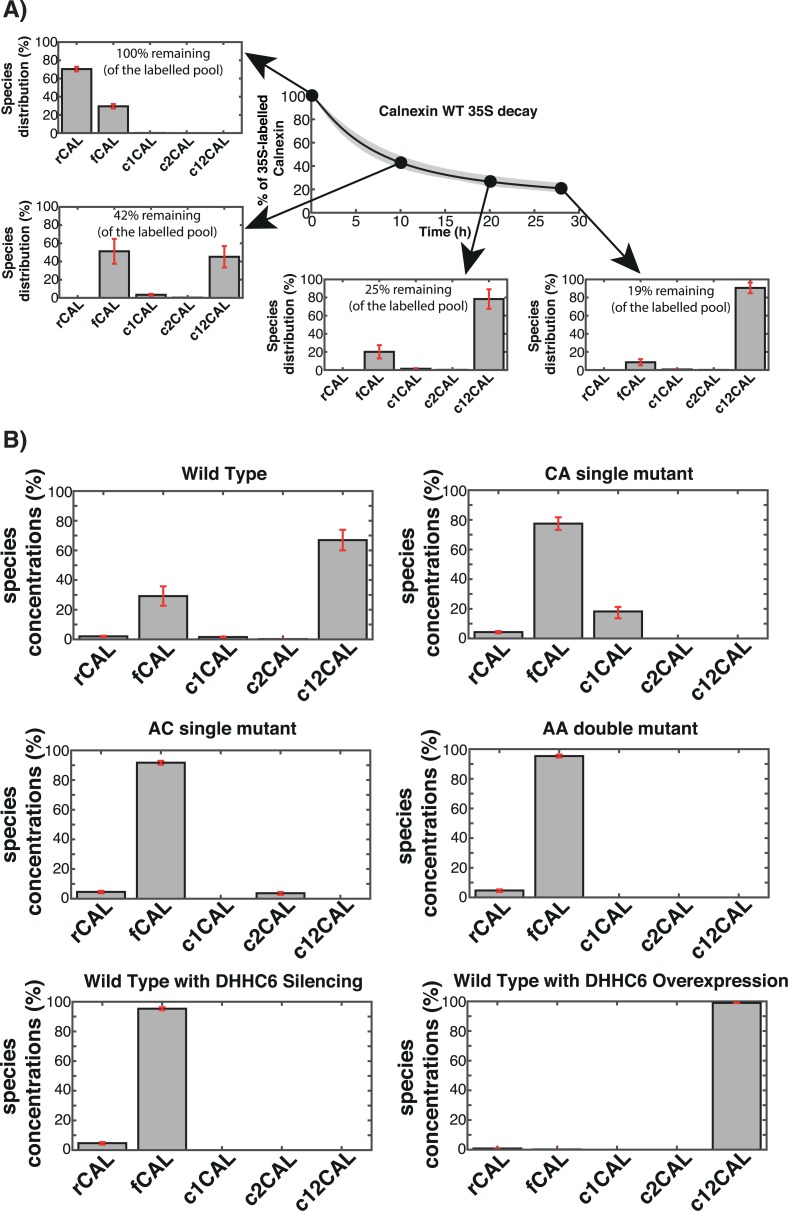
Fig 3. In silico analysis of the calnexin species distribution.
A: We replicated in silico the 35S pulse-chase experiment on WT calnexin. During the experiment we monitored the relative distribution of calnexin in the different palmitoylation states. Solid line is the mean of the simulations of 382 models; error bars are defined by the first and the third quartile of the simulations of 382 models (details of the in silico labelling experiment can be found in the Expanded View). B: The model was used to predict the steady state distribution of WT calnexin and of the mutants in the cell. rCAL correspond to calnexin during the synthesis, fCAL represent folded calnexin while c1CAL and c2CAL denote the two single palmitoylated species. c12CAL represents the double palmitoylated calnexin. Error bars correspond to first and third quartile of the simulations of 382 models (details of the in silico labelling experiment can be found in the Supplementary Information).

