Fig. 6.
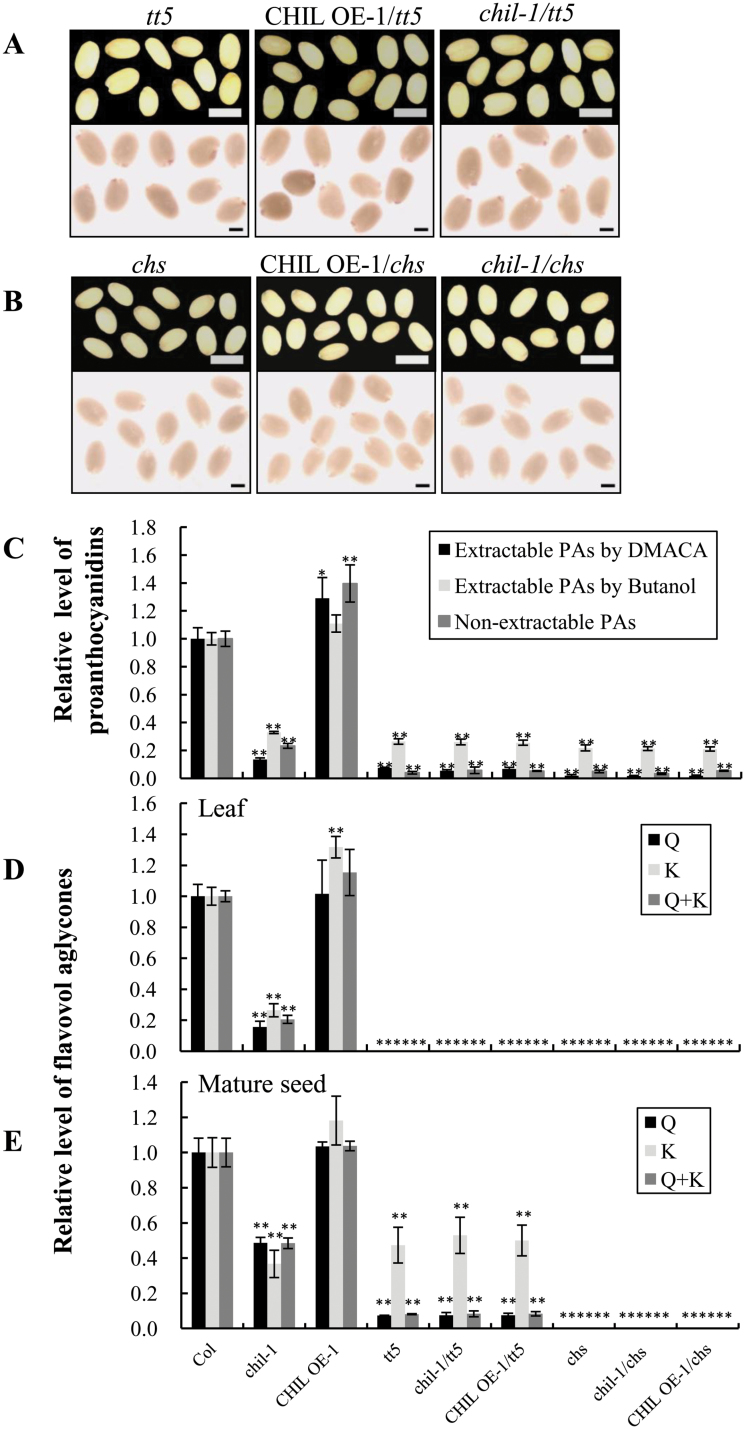
Characteristics of CHIL knockout and over-expression in the tt5 and chs background. (A) Seed phenotype of the lines tt5, chil-1/tt5, CHIL OE-1/tt5 (upper), stained with DMACA (lower). Bars=0.5mm. (B) Seed phenotype of chs, chil-1/chs, CHIL OE-1/chs (upper), stained with DMACA (lower). Bars=0.5mm. (C) Relative levels of proanthocyanidins in mature seeds of the above-mentioned plants. The extractable PAs measured by DMACA (2.64mg epicatechin equivalence g–1) and by butanol (1.08mg B2 equivalence g–1); non-extractable PAs (2.50mg B2 equivalence g–1) in Col were set as a value of 1.0, respectively. (D, E) Relative levels of the major flavonols [quercetin (Q) and kaempferol (K) aglycones] in 21-d-old seedlings (D) and mature seeds (E) of the above-mentioned plants. Levels of quercetin (4.79 µg g–1 dry weight and 584.27 µg g–1 dry weight in seedlings and seeds, respectively) and kaempferol (4.90 µg g–1 dry weight and 11.38 µg g–1 dry weight in seedlings and seeds, respectively) from wild-type control Col were set as a value of 1.0. (C, D, E) Data are presented as mean ±SD, Student’s t test (n=3, *P <0.05, **P <0.01). (This figure is available in colour at JXB online.)

