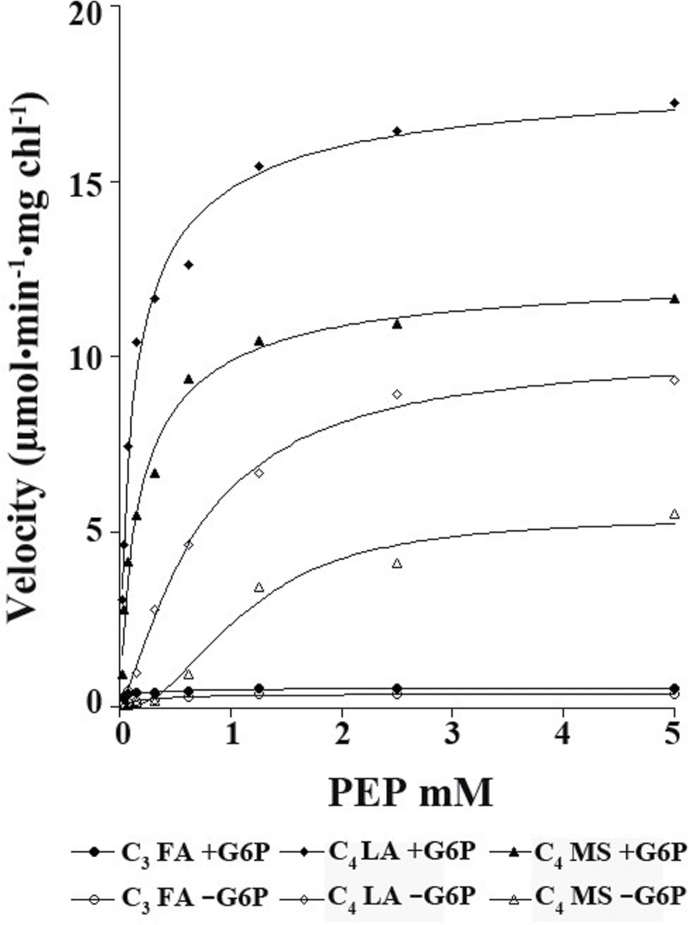
Fig. 1.
Representative PEPC kinetics based on photosynthetic mode (C4 or C3) and the amino acids present at residue 733 (M, L, or F) and residue 780 (A or S). PEPC rates were obtained at pH 7.6 with saturating Mg2+ and bicarbonate, while varying phosphoenolpyruvate (PEP) concentrations, either in the presence or absence of 5mM glucose-6-phosphate (G6P). The mean data points are presented for each PEPC type while species values are presented in Table 3. The solid line is the Hill equation fit to the data, see the Materials and methods for the equation details.

