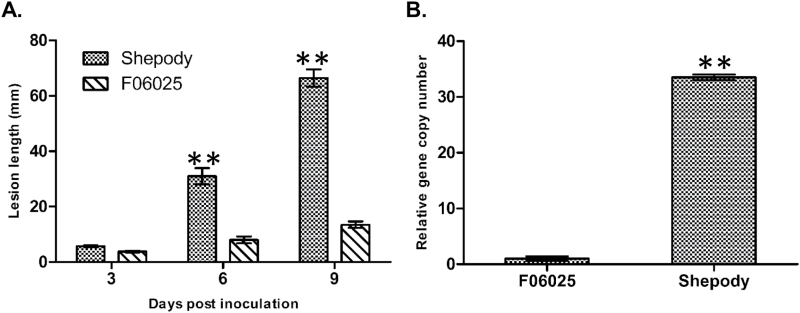
Fig. 1.
Disease progress curve and pathogen biomass in infected stems of resistant (F06025) and susceptible (Shepody) genotypes inoculated with P. infestans: (A) Late blight disease severity progress curve based on lesion length (mm) and (B) biomass of pathogen quantified as relative P. infestans-specific (O-8) gene expression at 6 dpi. Significant differences between susceptible and resistant plants using Student’s t-test: *P<0.05; **P<0.01.

