Fig. 3.
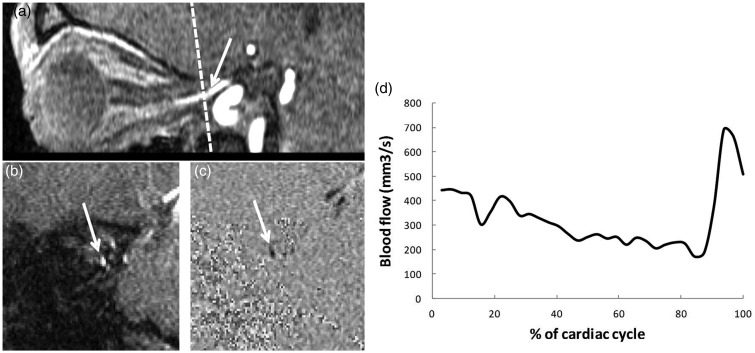
Phase-contrast (PC) MRI for the quantitative assessment of blood flow in the ophthalmic artery (OA). (a) A sagittal view of the right OA in a three-dimensional time-of-flight sequence. An oblique plane (dotted line) is placed perpendicular to the axis of the artery. (b) A coronal amplitude image (morphological image) obtained with PC MRI. The left OA appears as a white spot (arrow). (c) The corresponding phase image (functional image). The OA appears as a black spot (arrow). (d) A quantitative flow curve (mm3/s) for the left OA, obtained from the phase contrast sequence using segmentation software. The plot represents the change in blood flow over an average cardiac cycle.

