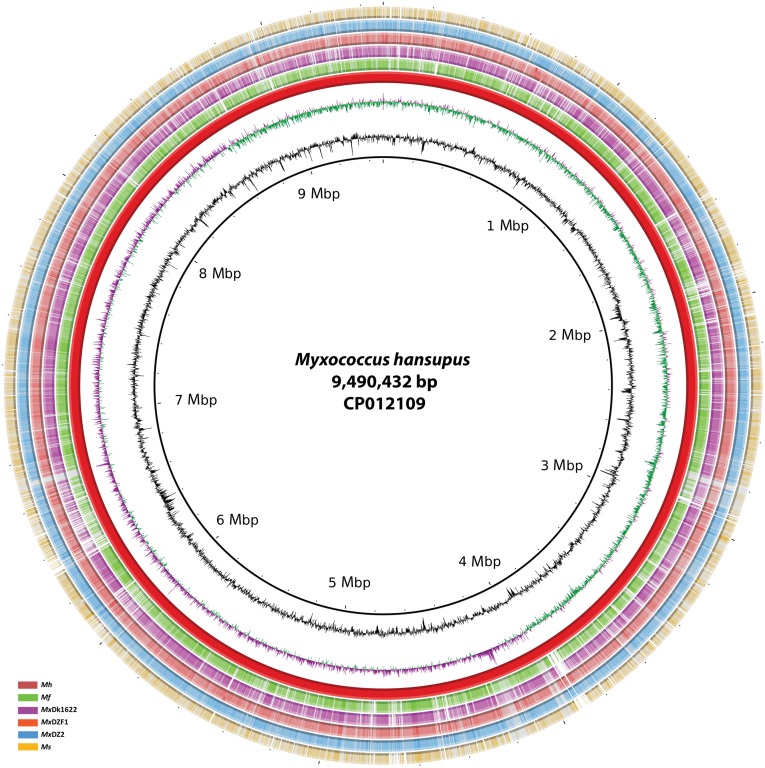
Fig 2. Circular representation of the M. hansupus complete genome.
Circles (from inside to outside) 1 and 2 (GC content; black line and GC skew; magenta and green lines), circle 3 (M. hansupus; red circle); circle 4 (mapped Myxococcus fulvus HW-1 genome with M. hansupus genome; green circle); circle 5 (mapped Myxococcus xanthus DK1622 genome with M. hansupus genome; purple circle); circle 6 (mapped Myxococcus xanthus DZF1 genome with M. hansupus genome; Orange circle); circle 7 (mapped Myxococcus xanthus DZ2 genome with M. hansupus genome; blue circle); circle 8 (mapped Myxococcus stipitatus genome with M. hansupus genome; yellow circle). BRIG 0.95 was used to build the circular representation [53]. Mapping studies were done using BLASTn with an E-value cut-off 1e-5.

