
Fig. 4.
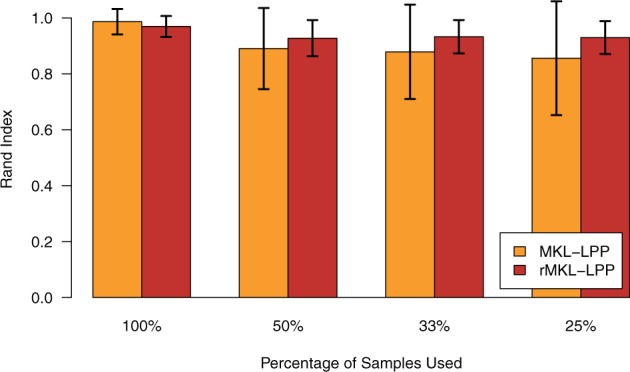
Comparison of the robustness of the clustering generated with and without regularization averaged over all cancer types for datasets of different sizes. The percentage on the x-axis denotes, how many patients were used for generating a smaller dataset on which leave-one-out cross-validation was performed. For each cancer type and each fraction of patients, we repeated the process 20 times. The error bars represent one standard deviation