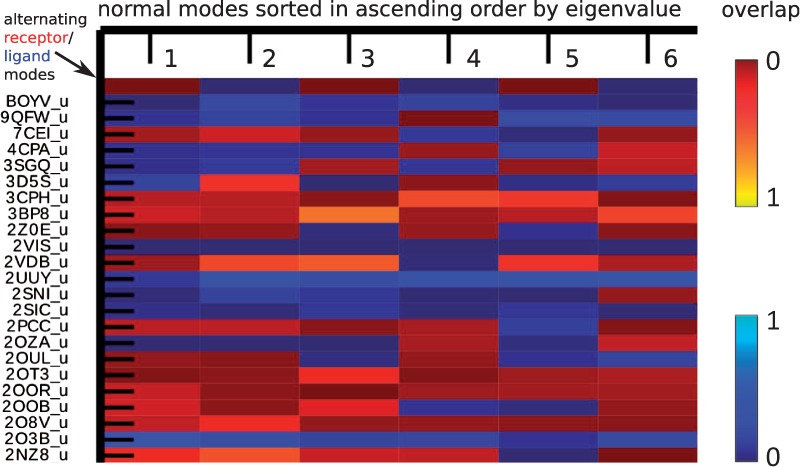
Fig. 7.

Normal mode spectrum. Each complex-derived mode is shown in a row, with a blue color indicating its origin being the ligand and red the origin being the receptor. The brightness reflects the amount of overlap between this particular mode and the conformational change. Only a subset of protein complexes and their first six non-trivial modes are shown here
