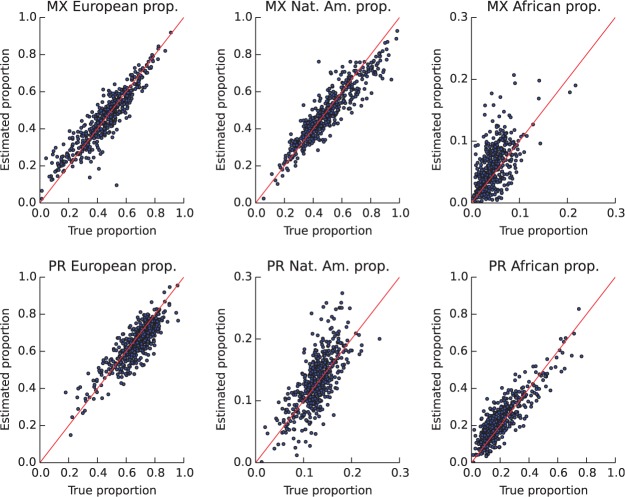
Fig. 2.
Comparisons of the estimated genomic ancestry of each parent with the ground truth. The top row is for Mexican samples, each dot corresponding to one parent: European proportions (left), Native American proportions (middle) and African proportions (right). The bottom row is for Puerto Rican samples: European proportions (left), Native American proportions (middle) and African proportions (right)

