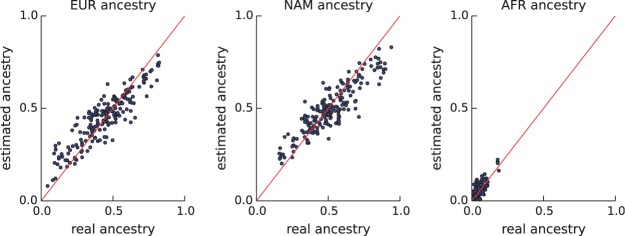
Fig. 4.
On simulated Mexican trios, comparisons of the estimated genomic ancestry of each parent with the ground truth. Each dot corresponds to one parent. The x-value shows the actual ancestry of the parent and the y-value shows the inferred ancestry. European, Native American and African ancestries are shown in the left, middle and right panels, respectively

