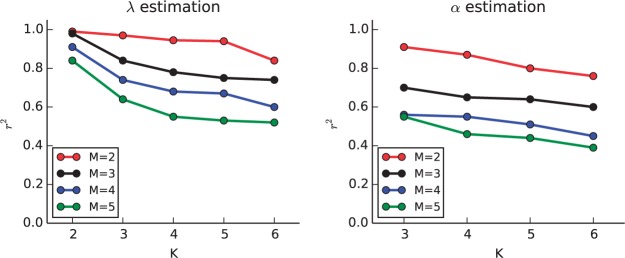
Fig. 5.
Experimental validation of inference for λ (left) and α (right) for pooled Gaussian semi-Markov processes. The X axis corresponds to the number of states K and different line colors correspond to different number of processes M. For the α estimations, K = 2 is trivial since all the α’s are 0.5, and is omitted

