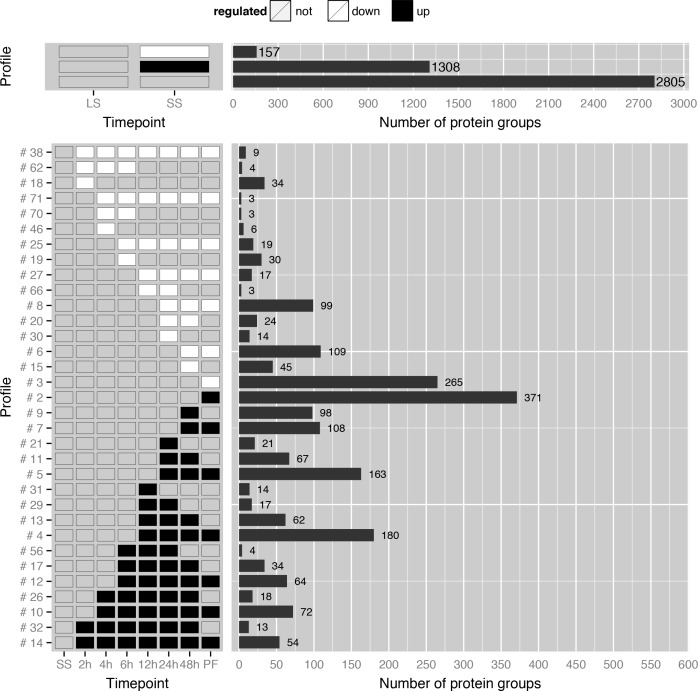
Fig 3. Categorization of protein groups with similar expression behavior into profile classes.
Selection of expression profiles changes between LS and SS (top panel) as well as during the differentiation from SS to PF (bottom panel). In the upper panel the first line are proteins downregulated from LS to SS transition, the second line are upregulated and the third line are unchanged proteins. Numbers of protein groups within each class are indicated next to the bars. In the lower panel, all down-regulated (white) and up-regulated proteins (black) are shown compared to the SS stage. Proteins were accounted as regulated if fold change > 2 and p-value < 0.05. An overview of all 207 profile classes is available in the S1 Fig on page 2. (LS: long slender form, SS: short stumpy form, PF: procyclic form)

