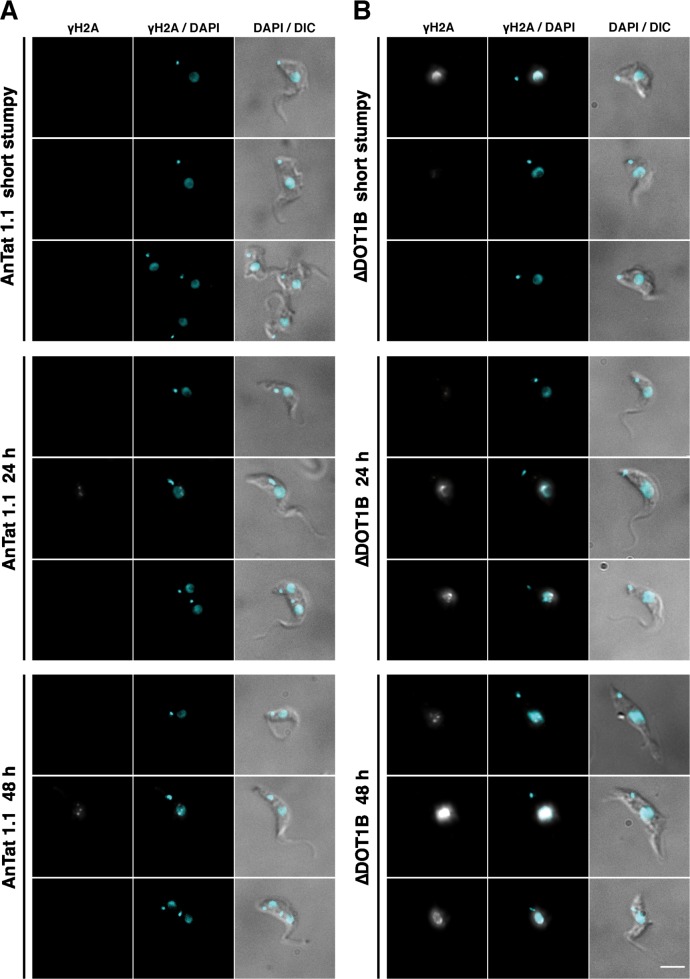
Fig 6. Accumulation of DNA damage in ∆DOT1B trypanosomes during differentiation.
Indirect immunofluorescence analysis of differentiating wild-type (A) and ∆DOT1B trypanosomes (B) using an antibody specific for phosphorylated H2A (γH2A). Representative cells are shown before induction of differentiation (upper panels), 24h post induction (middle panels) and 48h post induction (bottom panel). DNA was stained with DAPI (blue). Cells were visualized with differential interference contrast (DIC) microscopy. Scale bars: 5 μm.

