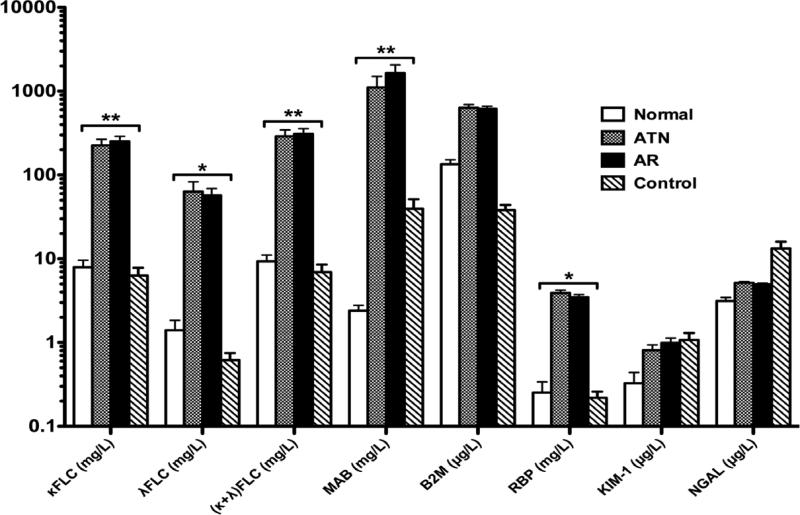
Figure 1.
Urinary biomarker in Normal, ATN, AR and Control groups. Urinary concentrations of κFLC, λFLC, (κ+ λ) FLC, MAB and RBP are significantly higher in both ATN and AR groups than either Control or Normal group, **P < 0.01 or *P < 0.05. There is no difference in urinary concentrations of β2-M, KIM-1 and NGAL between ATN or AR group and Control or Normal group.

