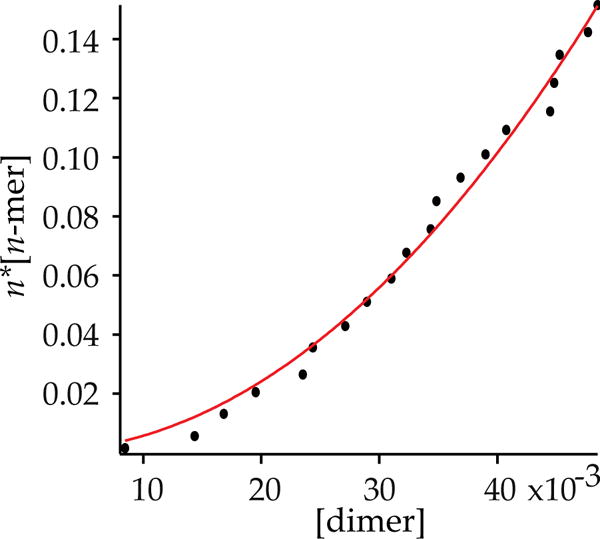
Figure 7.

Plot of concentration of dimeric 5 versus enolate normality to determine the tetramer aggregation state in neat THF at −60 °C. The curve corresponds to a best fit of y = n*Keq1/2(xn/2), such that y = n*[n-mer], x = [dimer], and n = aggregation number of the n-mer. The fit shows that n is 4.1 ± 0.2.
