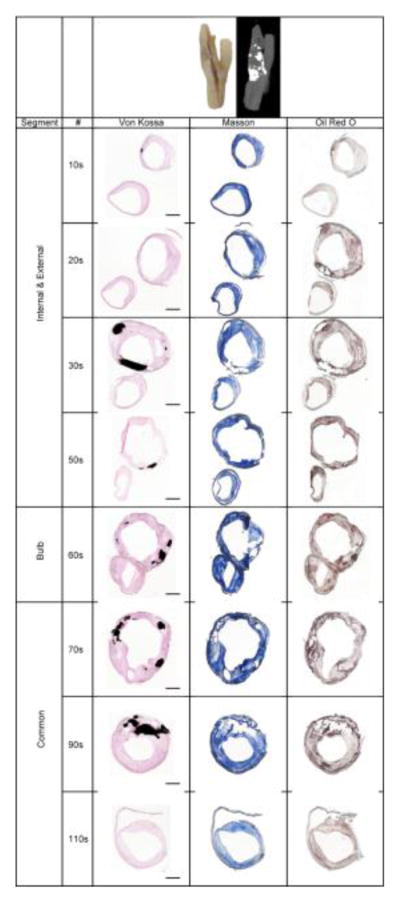
Figure 1.

A representative example of a macro tissue and its corresponding μ-CT images plus warped and morphed histological image showing the common, internal, external and bulb segments along the axis of a right CEA. Rupture of the calcified patches due to sectioning is evident, leaving the remnant of calcified fragments near the edge. The space void of calcified patch was rendered in black to show the entire calcified area in von Kossa images. # = tissue section number from distal side. Von Kossa: black = calcium phosphate; Masson’s trichrome: blue = collagen, red = fibrin; Oil Red O, red = lipid. Scale bar = 2mm.
