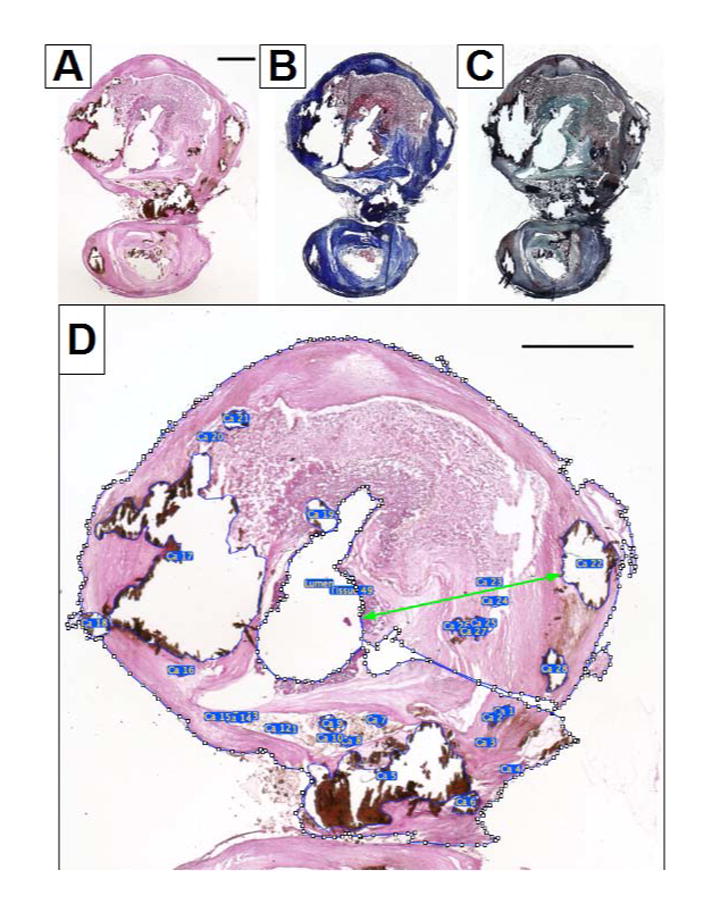
Figure 2.

Whole slide-scanned micrographs of a left CEA tissue near the bifurcation to illustrate the composition of an atherosclerotic plaque. Scale bar = 2mm. A): von Kossa staining shows the calcium phosphate in black. B): Masson’s trichrome staining shows the collagen in blue and fibrin in red. C): Oil Red O with Verhoeff counter staining shows the lipid in red and elastin in blue/black. D): A close up view of the internal segment of the von Kossa stained CEA tissue, the polygon selection function of the ImageJ software was used to delineate the lumen, tissue area and every calcified patch. The green double arrow line indicating the fibrous layer thickness for calcium patch number 22 (Ca 22). The lumen shape was irregular and lumen area was constricted.
