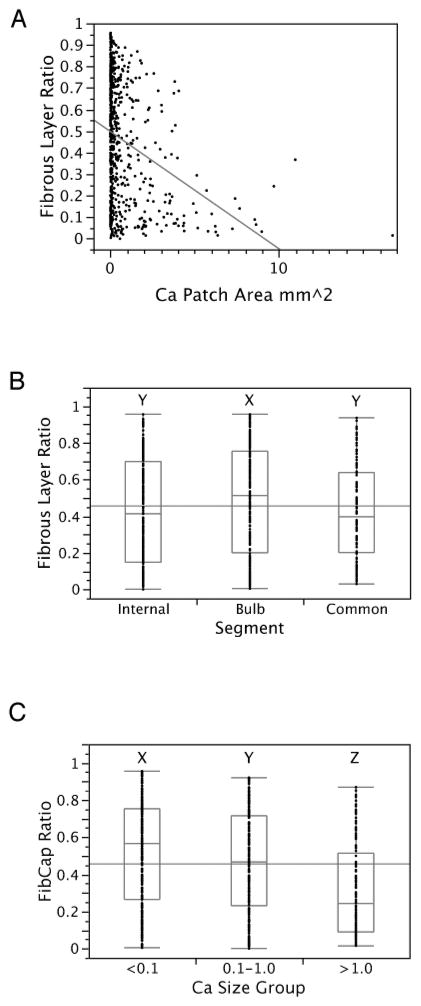
Figure 3.
A:) Bivariant graph between calcium patch area (n=622) and fibrous layer thickness ratio, linear extrapolation showed an inverse relationship. B:) Fibrous layer thickness ratios in internal (n=244), bulb (n=276), and common (n=102) segments. C:) Fibrous layer thickness ratios in <0.1mm2 (n=279), 0.1–1.0mm2 (n=210), and >1.0mm2 (n=133) size groups. The difference between groups is shown by the letter (X, Y or Z) above each group, where a shared letter indicates no significant difference (Tukey-Kramer pairwise analysis).

