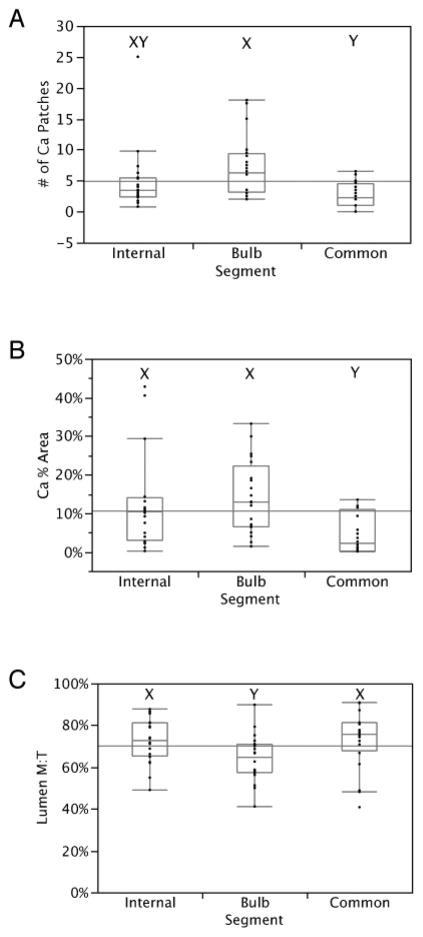
Figure 4.
Box and whiskers plots illustrating the mean, upper and lower quartile of the (A) number of calcified patches; (B) calcified area as a % of total tissue; (C) ratio of measured lumen area to hypothetical lumen area (M: measured, T: theoretical), between internal, bulb, and common segments of combined CEA (Lt+Rt). The difference between segment groups is shown by the letter (X, Y or XY) above each group, where a shared letter indicates no significant difference (Tukey-Kramer pairwise analysis).

