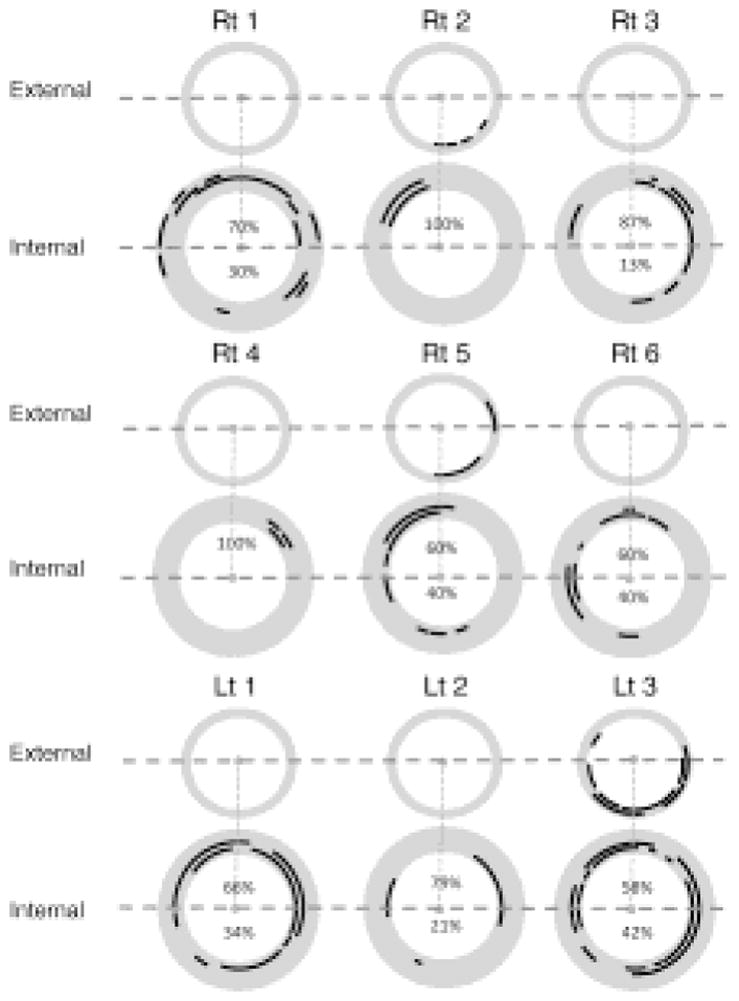
Figure 7.

Radial distribution of calcified patches in the external and internal branches of 9 CEA tissues. A black arc around the concentric circle represents the angle occupation by the calcified particle. The arcs in the same concentric circle represented the calcified particles located on the same tissue section. The outer rim represented the proximal side, and the inner rim represented distal side. The dotted line is perpendicular to the reference line (joins the centroids of the two lumens) and intersects the centroid of the internal lumen. The calcification area in each halves is expressed as a percentage of total calcification area. Rt: Right; Lt: Left.
