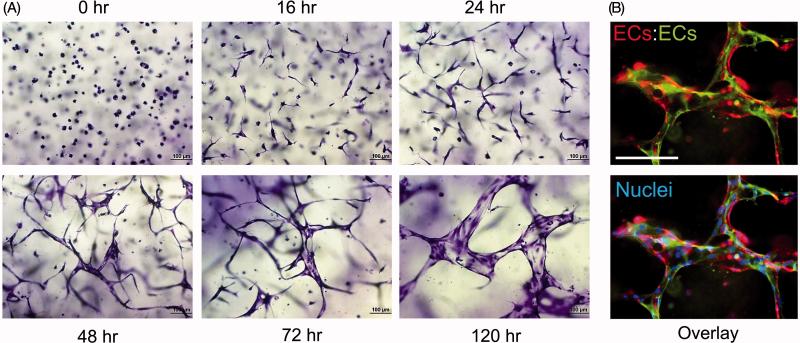
Figure 2. Time course of multicellular EC tube assembly in 3D collagen matrices.
(A) ECs were seeded as single cells within 3D collagen matrices (mimicking the developmental process of vasculogenesis) and form tubes in response to the “Factors”. They were fixed, stained, and photographed at the indicated time points. Marked EC tube morphogenesis is observed over time. Bar equals 100 μm. (B) GFP- and mCherry-labeled ECs were mixed together at a 1:1 ratio to reveal multicellular EC tube assembly after 72 hr of culture. Cultures were photographed under fluorescence, images were overlaid and the lower panel also shows nuclear staining after the addition of Hoechst dye. Bar equals 100 μm.

