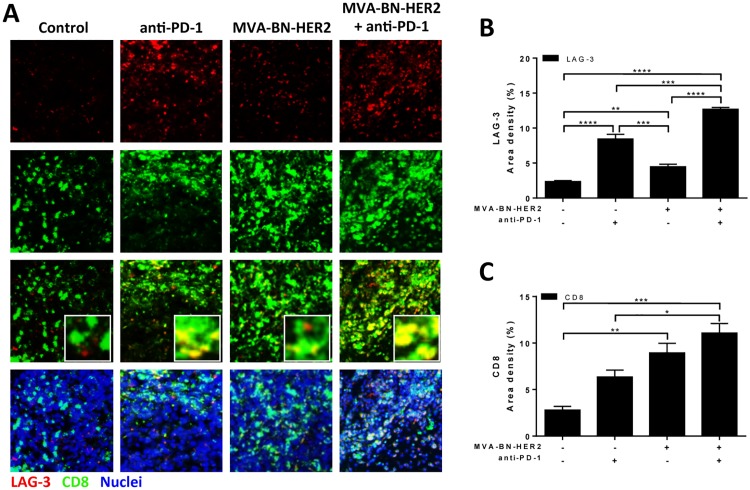
Fig 5. LAG-3 expression in the tumor microenvironment after MVA-BN-HER2 and anti-PD-1 therapy.
(A) Tumors from mice treated with MVA-BN-HER2 and/or anti-PD-1 were collected on day 16 and stained for LAG-3 (red), CD8 (green), and nuclei (DAPI, blue). (B) The area density for LAG-3. (C) The area density for CD8+ T cells.* p<0.05, ** p<0.01, *** p<0.001, **** p<0.0001. n = 3–4 mice/group.

