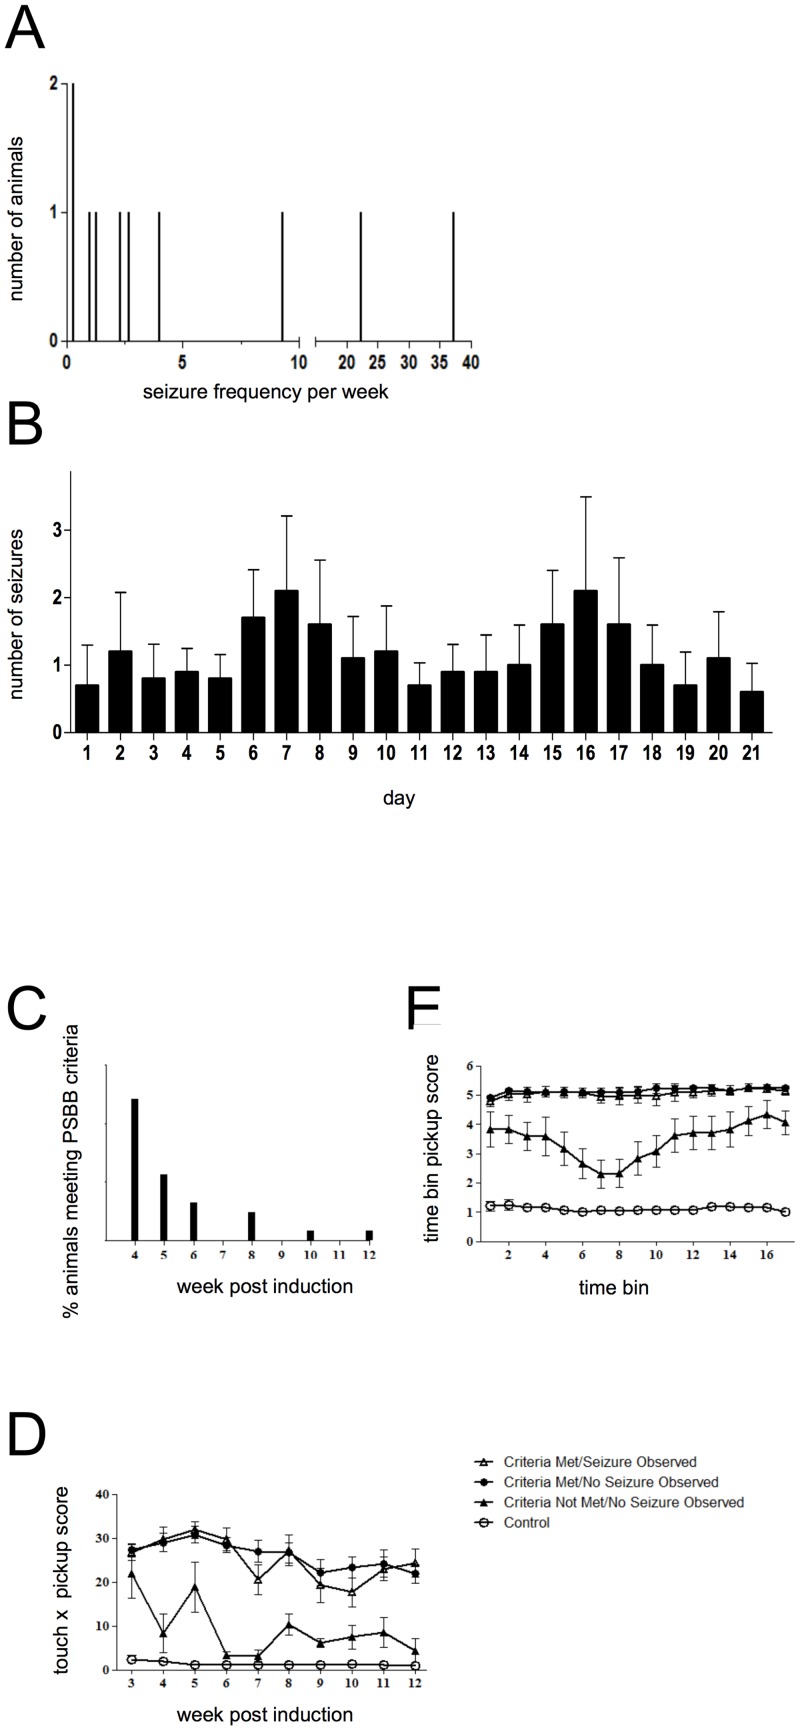
Fig 1. Behavioral measurements of epilepsy following induction.
A. Distribution of weekly seizure frequency as observed during video monitoring (n = 10) B. Mean daily seizure frequency of animals during the recording period, data are expressed as mean ± SEM (n = 10). C. The percentage of animals meeting PSBB criteria at various weeks post-induction (n = 31). D. Touch x pickup and E. time bin pickup PSBB scores of animals having undergone status epilepticus induction (n = 37) and age-matched controls (criteria met/seizure observed, n = 13; criteria met/no seizure observed, n = 18; criteria not met/no seizure observed, n = 6; control, n = 12).

