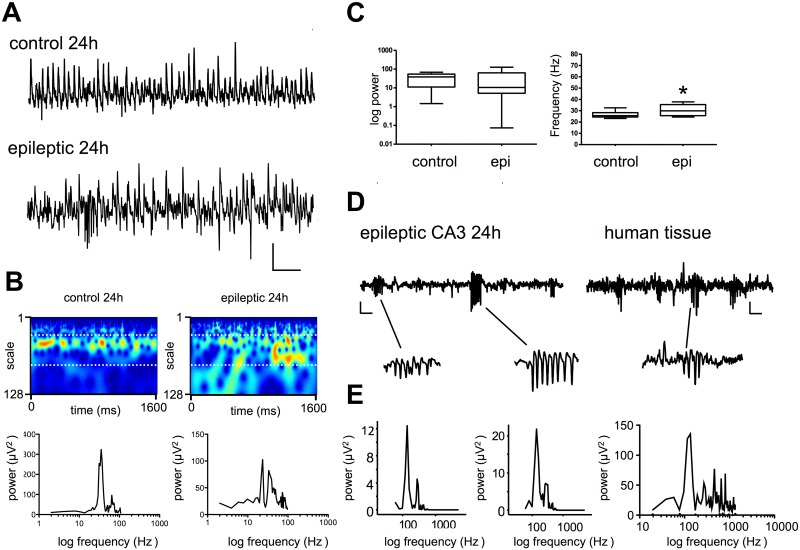
Fig 2. At 24h post induction LFP recordings show gamma oscillations and fast bursts in CA3.
A. Example traces recorded 24h post induction and in controls. Scale bar 200 ms x 50 μV. B. Example Morlet-wavelet spectra and power spectral density plots of the same traces, white dotted lines on spectra indicate 20–60 Hz pseudo-frequency band. C. Pooled power and frequency plots for control and PSE 24. D. Fast ripples recorded in CA3 at 24h and similar activity seen in temporal neocortex from a human patient with TLE. E. Power spectra from ripples identified in D (rightmost panel from human tissue).

