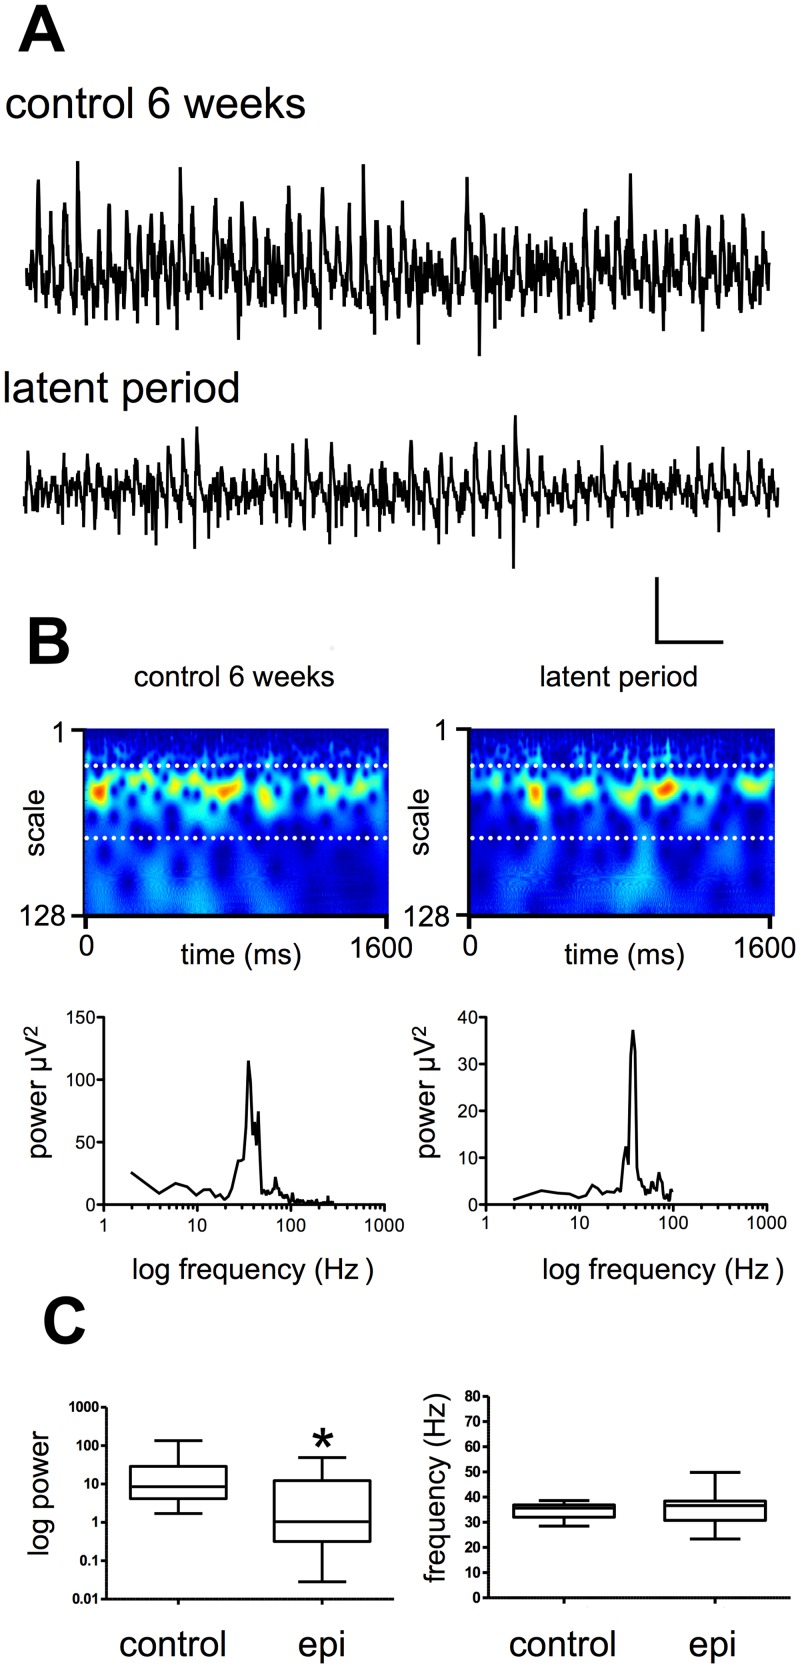
Fig 3. Spontaneous network activity in CA3 during the latent period.
A. Raw data from CA3 recorded during the latent period and in controls. Scale bar 200 ms x 50 μV. B. Power spectral density plots of the activity shown in A. C. Example Morlet-wavelet spectra and power spectral density plots of the same traces, white dotted lines on spectra indicate 20–60 Hz pseudo-frequency band. C. Pooled power and frequency plots for control and latent period.

