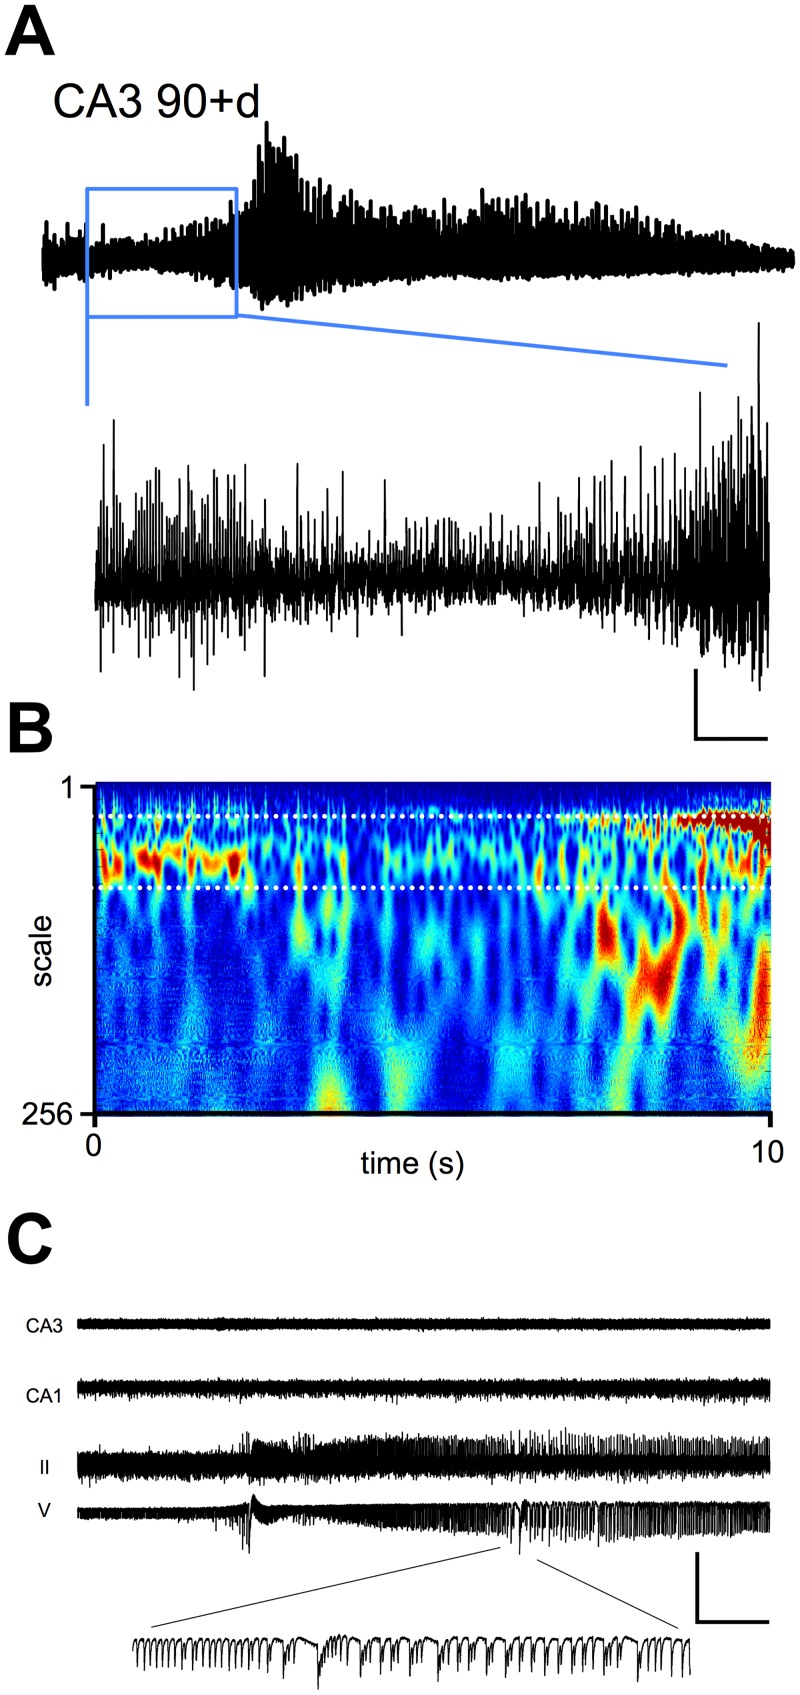
Fig 5. Appearance of ictal-like events in CA3 and mEC in vitro.
A. Example ictal-like event recorded in CA3 in slices from a PSE 101 day animal with confirmed SRS. Trace length 50 s. Blue box denotes expanded timescale (scale bar 950 ms x 550 μV). B. Example Morlet-wavelet spectrum of the area delineated by the blue box in A. C. Example recording made in CA3, CA1, layers V and II of mEC during an ictal-like event generated in mEC (scale bar 950 ms x 500 μV), a section is shown at an expanded temporal scale for clarity.

