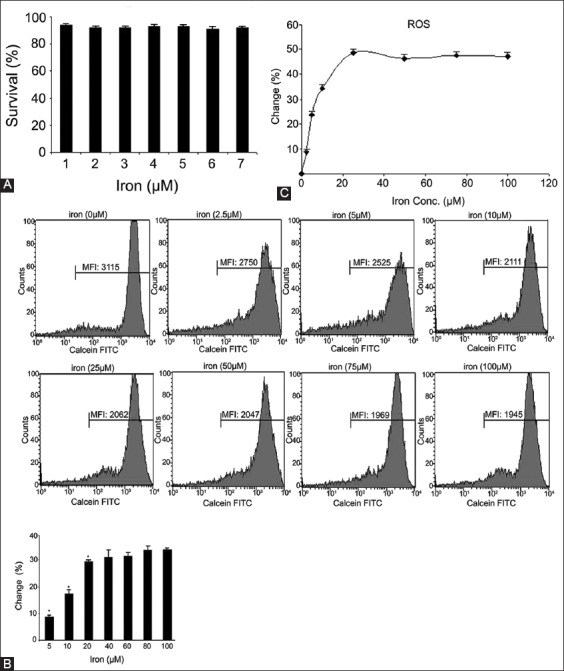
FIGURE 1.

(A) Cytotoxic effect of iron at different concentrations in K562 cells. The cells were treated with iron (0, 5, 10, 20, 60, 80, and 100 µM) for 24 hours. Results are expressed as the mean percentage of control (mean ± standard deviation [SD], n = 3), (B) Flow cytometry measurements of iron uptake in K562 cells. The cells were loaded with 0.5 µM calcein-acetoxymethyl (CA-AM) at 37°C for 30 minutes. Excess CA-AM on the surface was removed by washes with Hank’s balanced salt solution; the cells were resuspended and incubated with iron at different concentrations for 1 hour. The data for each dose were calculated as the percent change in the melt flow index following incubation with iron. Iron uptake at concentrations of 5, 10, 20 µΜ significantly increased (*p < 0.05), (C) Flow cytometry measurements of reactive oxygen species in K562 after adding iron at above concentrations (means ± SD, n = 3).
