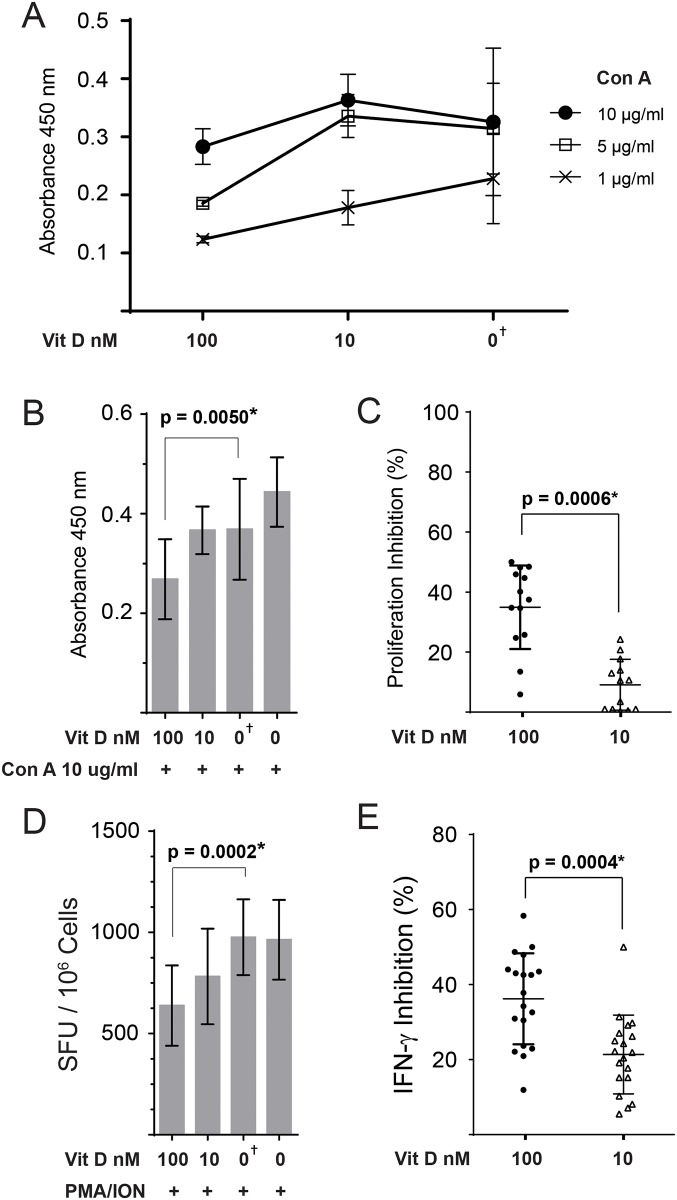
Fig 1. Vitamin D inhibits chicken T-cell proliferation and IFN-γ production ex vivo.
Splenocytes were pre-treated for 4hrs with Vitamin D (100 and 10 nM) or vehicle only (DMSO). (A) BrdU incorporation measured by ELISA assay to quantify T cell proliferation after stimulation with different concentrations of Concanavalin A. The results are presented as absorbance at OD450 from three independent experiments with 3–4 biological replicates in each experiment. (B, C) The combined results from proliferation from 6 independent experiments for absorbance at OD450 (B) and the percentages of inhibition by Vitamin D are shown. (D) The frequency of IFN-γ producing mononuclear cells stimulated with a T-cell stimulation cocktail of PMA and Ion was detected using a chicken IFN-γ ELISPOT assay. The results are presented as spots forming unit (SFU) per 1.0 x 10⁶ cells from five independent experiments with 3–5 biological replicates in each experiment (19 replicates in total). (E) Represents the percentage of inhibition for IFN-γ production by mononuclear cells after Vitamin D3 pre-treatment from five independent experiments. Each dot represent a biological replicate. Non-parametric Wilcoxon tests (Mann-Whitney) was used to assess normal distribution and test significance. The results are shown as mean ± SD. † (symbol) represents cells treated with Vehicle only (DMSO). * indicates a statistically significant difference (P < 0.05).

