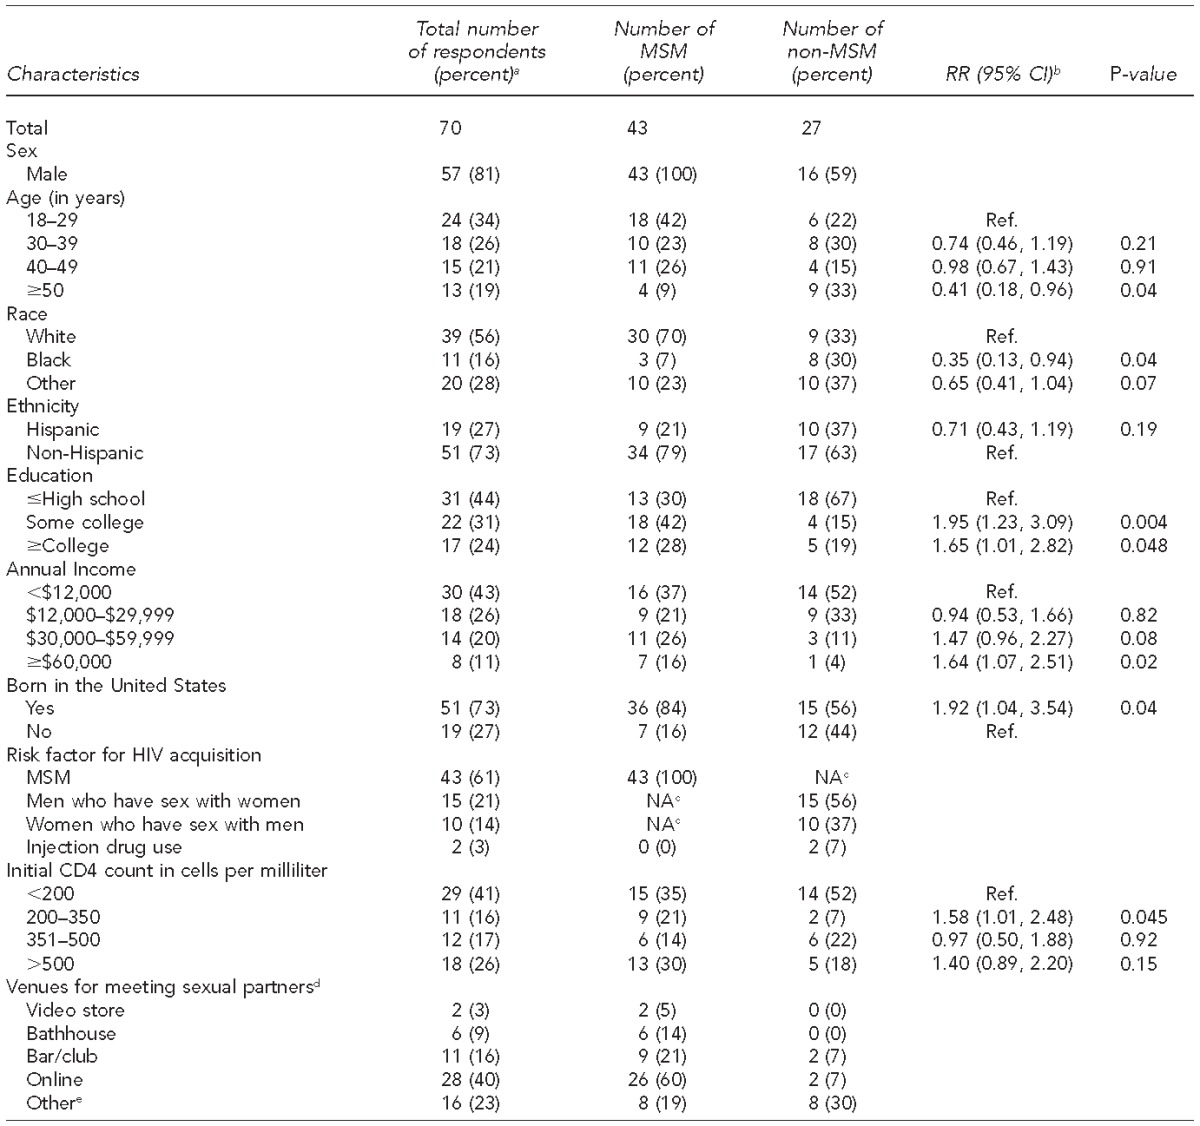
Table 1.
Demographic and clinical characteristics of study respondents newly diagnosed with HIV, Rhode Island, 2013

aA total of 74 people were newly diagnosed with HIV in Rhode Island in 2013, of whom 70 people were interviewed and included in the analysis. Percentages may not total to 100 due to rounding.
bUnadjusted RR was calculated via bivariable log binomial models and represents the increase (RR>1.0) or decrease (RR<1.0) in risk for having a particular demographic characteristic for MSM relative to non-MSM. Significance was defined as p<0.05.
cIndicates this risk factor does not apply to this population
dCategories are not mutually exclusive; as such, column totals may exceed 100%. The small number of non-MSM precluded estimation of RR for the venues for meeting sexual partners.
e“Other” includes any venue for meeting sexual partners (cruising area, sex party, gym), other than those already specified, provided in response to the question, “In the 12 months before you tested positive for HIV, where did you meet sexual partners in Rhode Island?”
HIV = human immunodeficiency virus
MSM = men who have sex with men
RR = relative risk
CI = confidence interval
NA = not applicable
