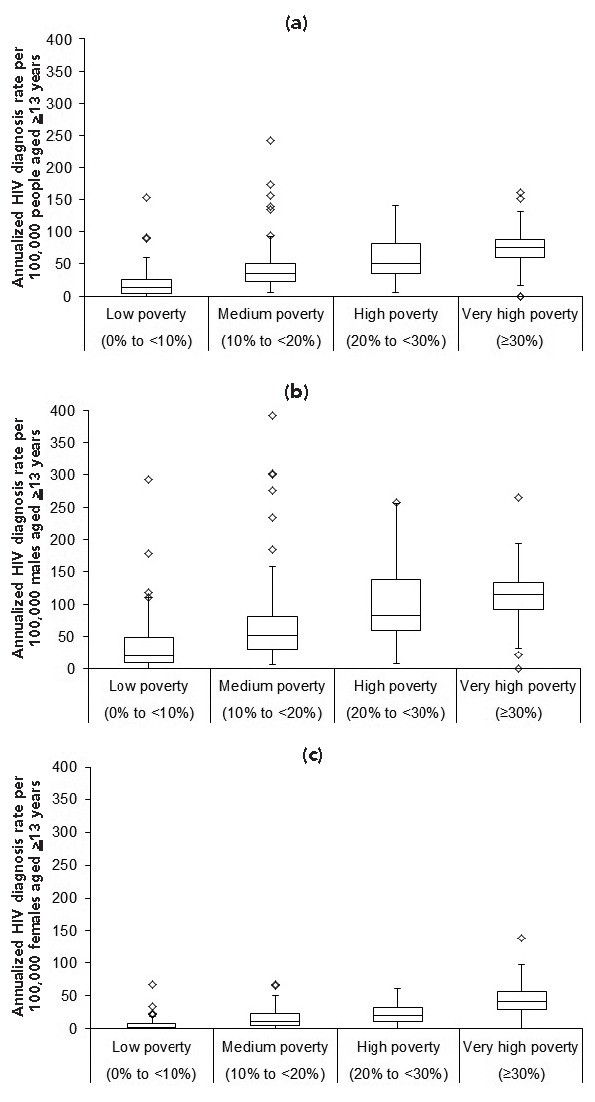
Figure 2.
Annualized HIV diagnosis rates per 100,000 males aged ≥13 years, by ZIP Code poverty level (percentage of population below federal poverty threshold), (a) overall, (b) among males, and (c) among females, New York City, 2010–2011a

aBoxes include ZIP Codes with diagnosis rates between the first and third quartile of diagnosis rates within the poverty level. The line in each box is the median ZIP Code-level diagnosis rate within the poverty level. Ends of the whiskers are set at 1.5* interquartile range (IQR) above the third quartile and 1.5*IQR below the first quartile. Each diamond (◊) represents one ZIP Code outlier.
