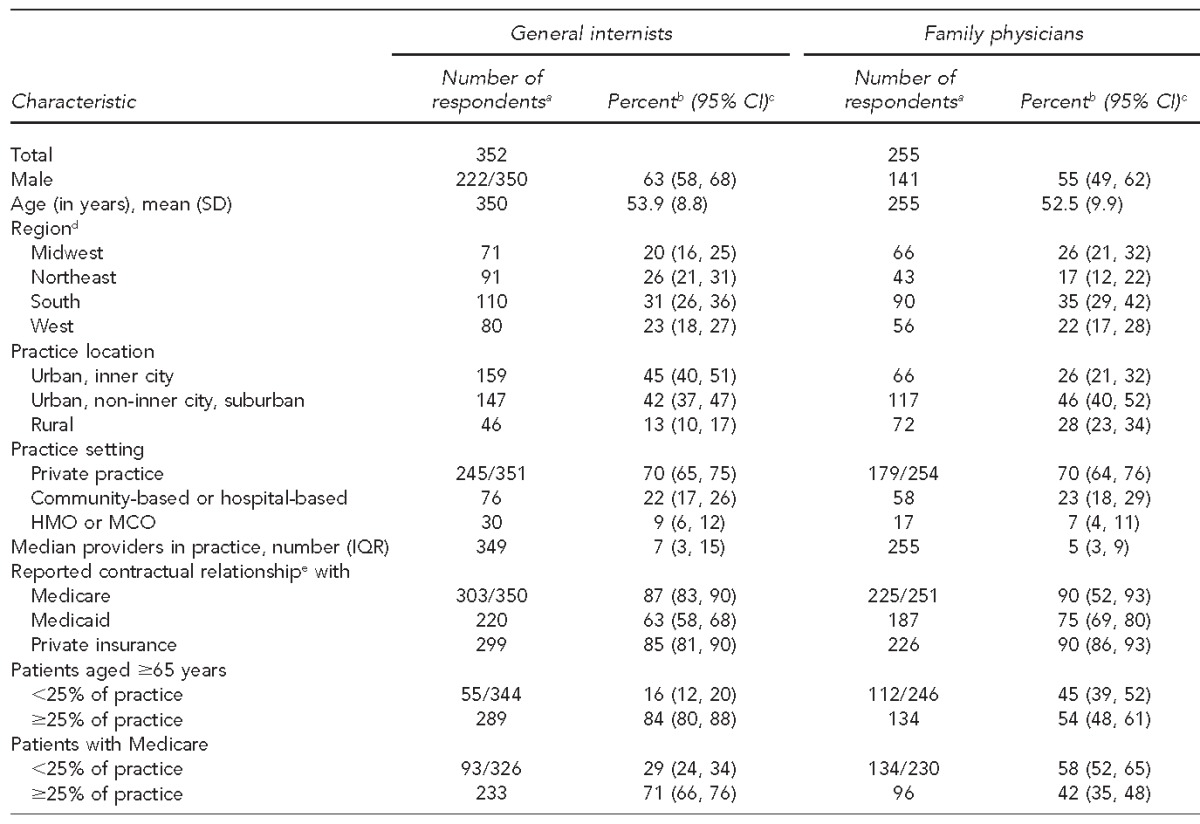
Table 1.
Demographic and practice characteristics of survey respondents, by physician specialty, in a study of physician attitudes toward adult vaccines and other preventive practices, United States, 2012

aDenominators that differ from total number of respondents are indicated and apply to all values in the category indicated.
bSome column percentages do not total to 100 because of rounding.
cExcept for age (mean [SD] years) and providers in practice (median [IQR])
dAccording to the U.S. Census Bureau regions established in 1942. Midwest: Illinois, Indiana, Iowa, Kansas, Michigan, Minnesota, Missouri, Nebraska, North Dakota, Ohio, South Dakota, Wisconsin; Northeast: Connecticut, Maine, Massachusetts, New Hampshire, New Jersey, New York, Pennsylvania, Rhode Island, Vermont; South: Alabama, Arkansas, Delaware, District of Columbia, Florida, Georgia, Kentucky, Louisiana, Maryland, Mississippi, North Carolina, Oklahoma, South Carolina, Tennessee, Texas, Virginia, West Virginia; West: Alaska, Arizona, California, Colorado, Hawaii, Idaho, Montana, Nevada, New Mexico, Oregon, Utah, Washington, Wyoming.
cRespondents reported having a contractual relationship with these entities.
CI = confidence interval
SD = standard deviation
HMO = health maintenance organization
MCO = managed care organization
IQR = interquartile range
