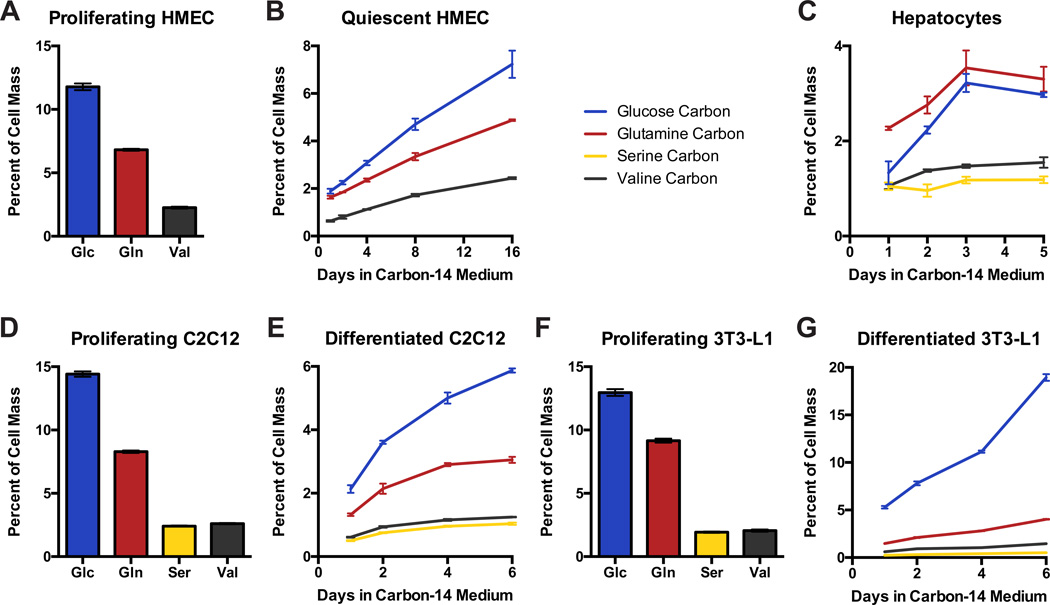
Figure 4. Carbon contribution to non-proliferating cell mass.
Using carbon-14 tracers, carbon from glucose (Glc), glutamine (Gln), serine (Ser), and valine (Val) was traced into cell mass of: (A) proliferating human mammary epithelial cells (HMEC), (B) arrested HMEC, (C) primary hepatocytes, (D) proliferating C2C12 myoblasts, (E) differentiated C2C12 myocytes, (F) proliferating 3T3-L1 fibroblasts, and (G) 3T3-L1 differentiated into adipocytes. Carbon incorporation into proliferating cells is shown at steady state, whereas incorporation over time is shown for non-proliferating cells. Each bar represents the average of N=3 replicates, ±S.D.

