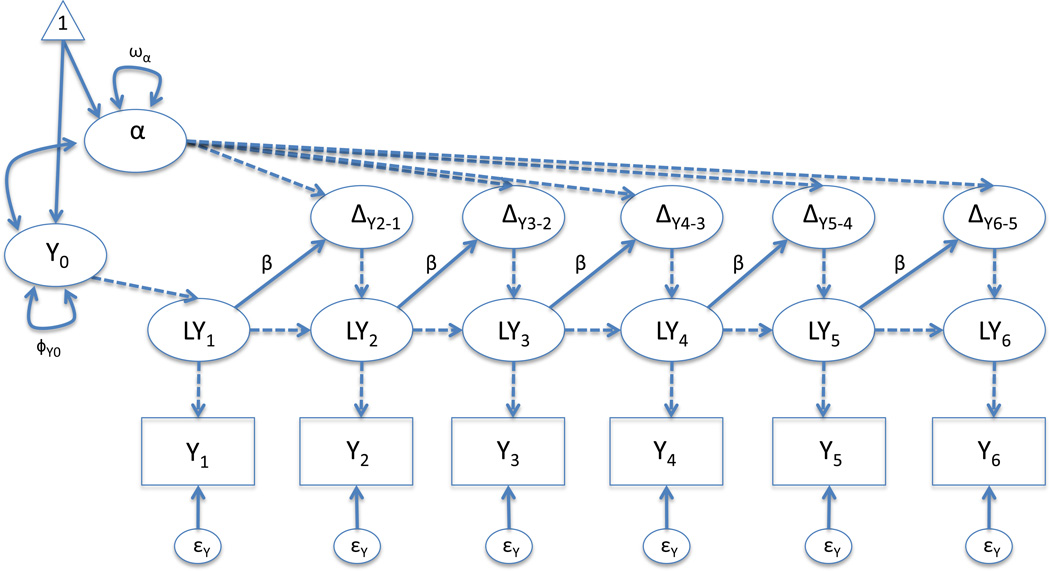
Figure 2.
Example path diagram of a latent change score model of a single outcome in time measured on six occasions. Measures are assumed to be equally spaced in time. To generate equation 1, all parameters are equated through time. All dashed pathways represent parameters fixed to one. All variances, covariances, and means are shown (thus when not illustrated, they are fixed to zero).

