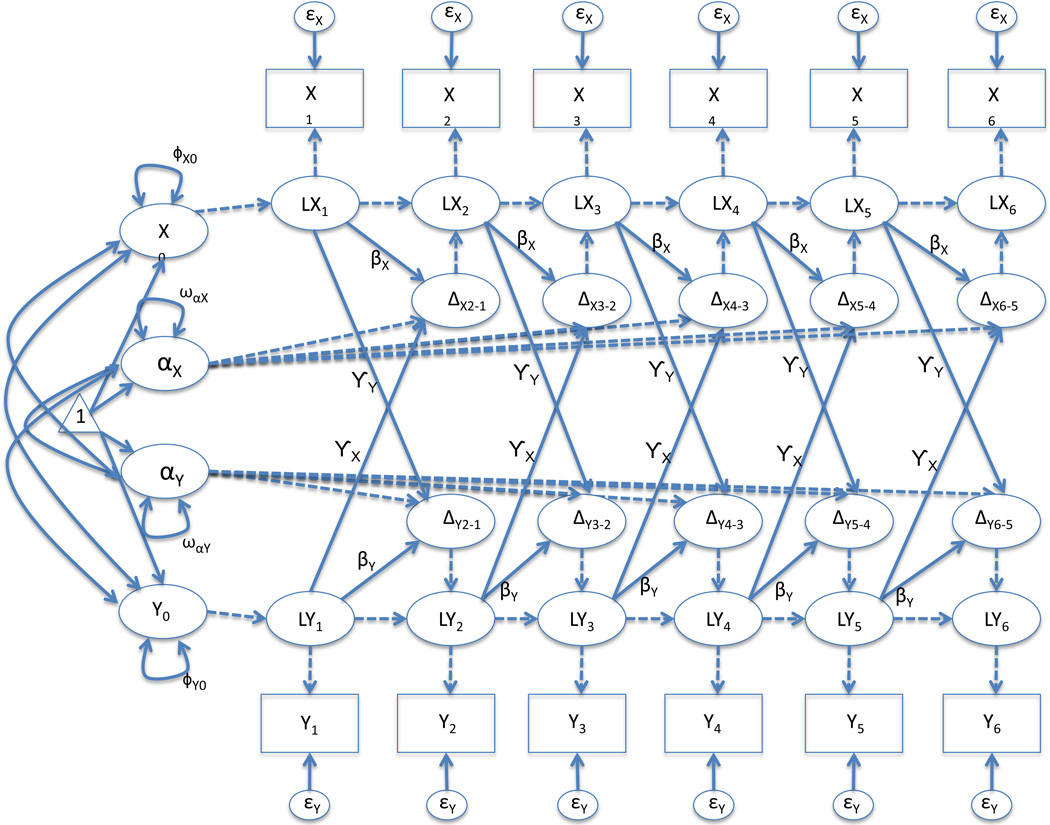
Figure 3.
Example path diagram of a latent change score model with two outcomes in time measured on six occasions (known as a bivariate latent change score model). This method creates an ambiguity on the interpretation of the various types of coordinated behaviors. To generate equation 2, all parameters are equated through time. All dashed pathways represent parameters fixed to one. All variances, covariances, and means are shown (thus when not illustrated, they are fixed to zero).

