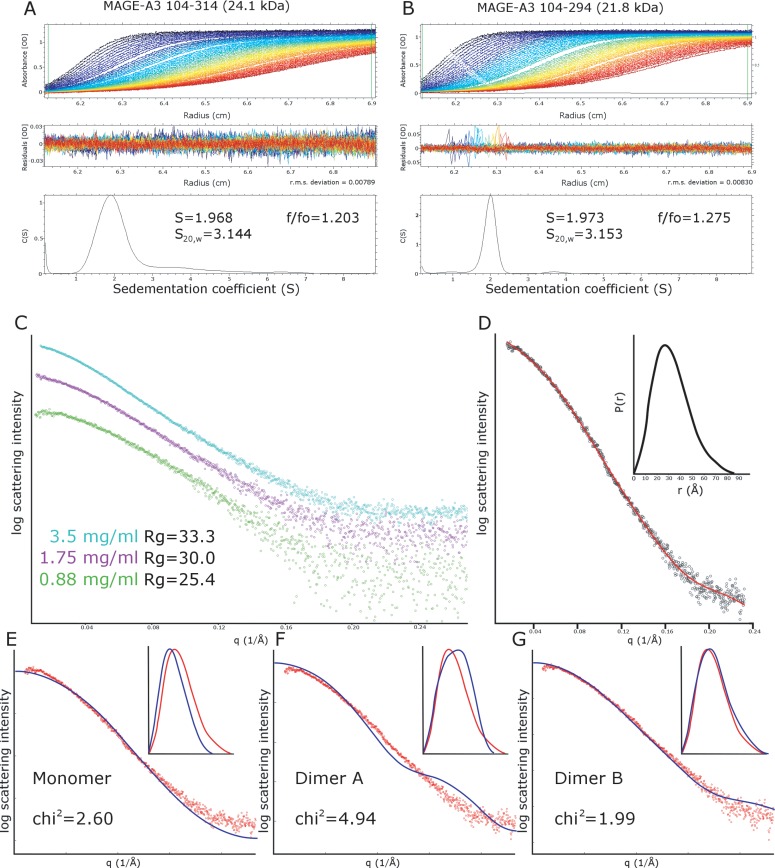
Fig 5. Analysis of MAGE-A3 in solution.
(A-B) Analytical ultracentrifugation of MAGE-A3 constructs with (A) and without (B) the C-terminal peptide required to form type A dimers. The raw absorbance data plotted as a function of radius and time is shown in the top panel, the centre panel shows the distribution of residuals from the fit of the diffusion deconvoluted continuous distribution c(s) model, and the bottom panel shows the distribution of sedimentation coefficient values from the data fit. (C) Small angle X-ray scattering curves for MAGE-A3 (construct 104–314, containing the C-terminal peptide), collected at three different protein concentrations show significant concentration dependence in the Guinier region. (D) Distance distribution function P(r), calculated from the MAGE-A3 SAXS data, the main plot shows the fit of the P(r) function to the data with the distribution in the insert. (E-G) Comparisons of the experimental SAXS data and theoretical SAXS curves calculated from the MAGE-A3 monomer (E), dimer A (F) and dimer B (G). The main plot shows the fit in reciprocal space using the program CRYSOL[33], and the insert shows the fit in real space calculated with the program SCATTER (www.biosis.net).

