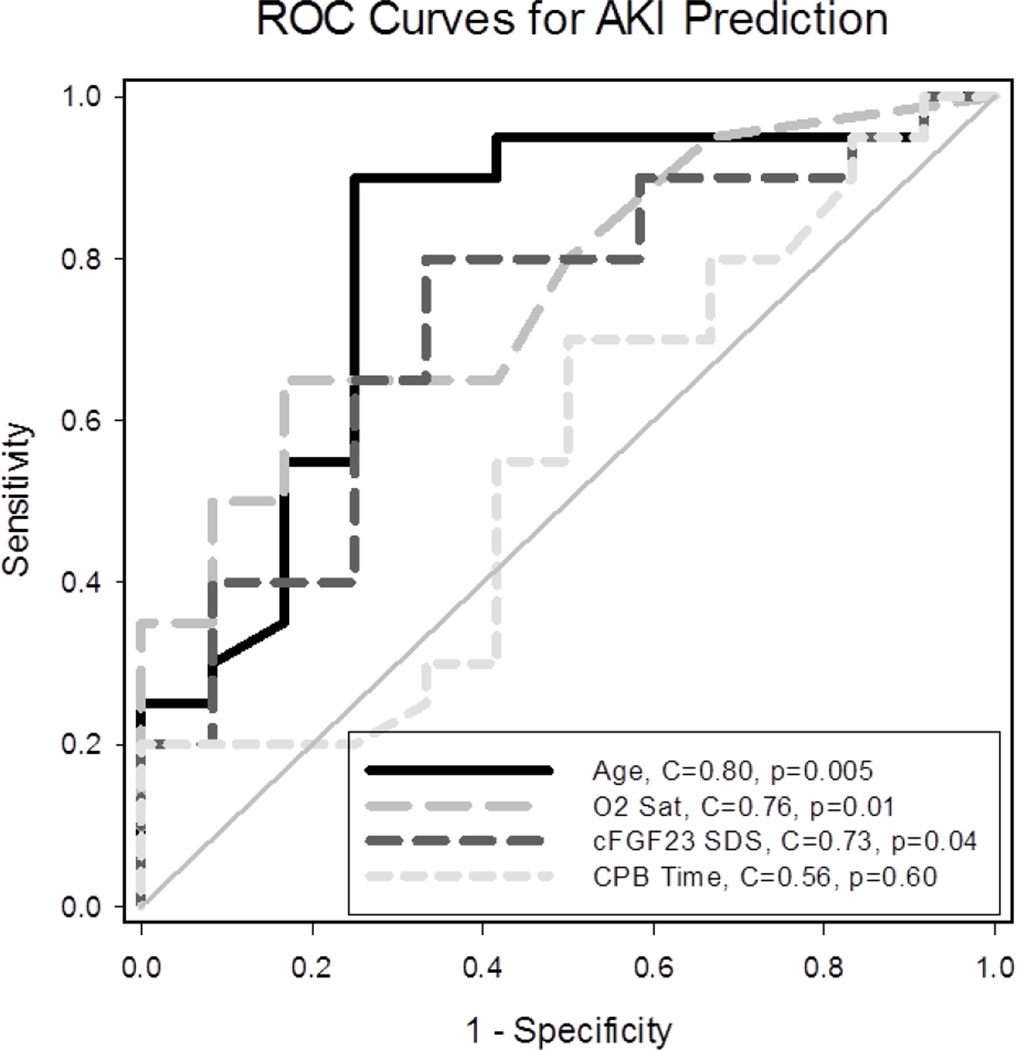
Figure 2.
Receiver operating characteristic (ROC) curves for acute kidney injury (AKI) prediction. The C statistic represents the area under the ROC curve. The C statistic ranges from 0.5, which is denoted by the diagonal line and corresponds to no predictive ability, to 1.0, which represents perfect predictive ability. Individually, age, pre-operative oxygen saturation, and pre-operative cFGF23 age-adjusted SDS predicted post-operative CPB- associated AKI.

