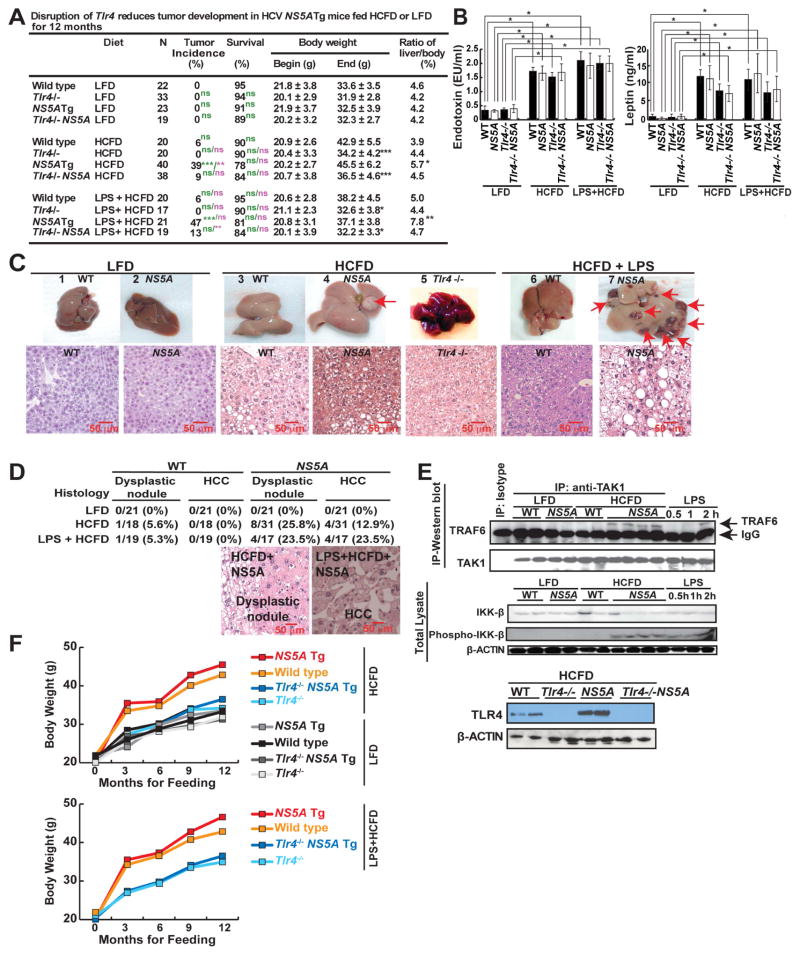
Figure 1. NS5A Tg mice fed high-cholesterol high-fat diet (HCFD) with or without LPS frequently developed tumors.
(A) Summary of WT and Tlr4−/− HCV-NS5A Tg mice fed control diet or HCFD with or without LPS from 8 weeks of age for 12 months; N, number of experimental mice (WT-HCFD; *, P<0.05 **, P<0.01 ***, P<0.005, green scripts and symbols – statistical analysis in comparison to LFD, purple scripts and symbols - statistical analysis in comparison to HCFD). (B) Plasma endotoxin and leptin levels in mice fed low-fat diet (LFD) or HCFD. (C) Gross images of non-pathological liver from control diet (1, 2) and liver tumor with multiple nodules from HCFD (3–6) and HCFD+LPS (7). Lower panel shows histology of respective groups. The HCFD tumor shown (arrow) is a dysplastic nodule. (D) Frequencies of liver dysplastic nodules and HCCs in LFD- or HCFD-WT or NS5A Tg mice fed LFD or HCFD for 12 months. Representative H&E staining of tumor sections from WT or NS5A Tg mice fed HCFD or LPS+HCFD. The histopathology of the tumors (arrows) shown are dysplastic nodules (DNs) or hepatocellular carcinomas (HCCs) based on their hypercellularity. Nodular lesions differ from the surrounding liver parenchyma with cytological or structural atypia. (E) Normal liver/liver tumor lysates from WT and NS5A Tg mice fed control chow or HCFD were analyzed for LPS-induced TLR4 signaling. Upper panel, TRAF6 interaction with TAK1, was enhanced in NS5A Tg mice fed HCFD. The interaction between TAK1 and TRAF6 were examined by immunoblots post immunoprecipitation (IP) with TAK1 antibody. As a positive control (shown in last three lanes) mice were challenged with LPS; LPS injected (2 mg/kg) 30 mins, 1 or 2 hours, respectively, before liver tissues were collected for analysis. The relative densitometry units and details are available in supplementary Figure 1A. Bottom panel, LPS-induced phosphorylation of IKK-β in the liver was increased in NS5A Tg mice fed HCFD. Positive controls (last three lanes), as explained previously. (F) Data summary of body weight changes over 12 month feeding period and statistics are available in (A). The scale bar equals 50μm.

