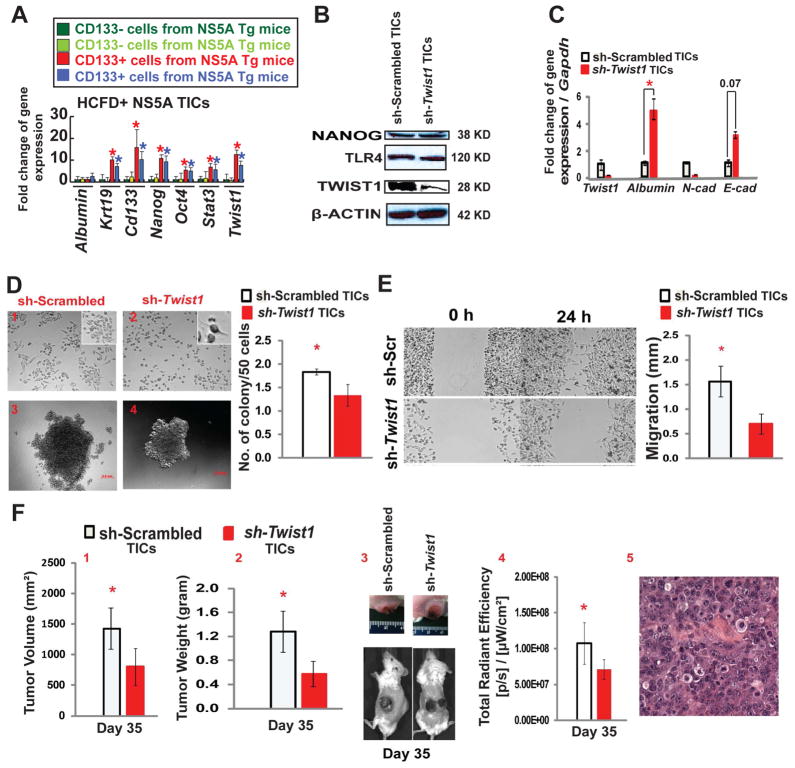
Figure 3. Twist1 is required for mesenchymal morphology of TICs, down regulation of Twist1 reduces TIC cancer-initiating property.
(A) CD133+/CD49f+/CD45− cells were isolated from tumors of two different HCFD-fed NS5A Tg mice and examined for stemness gene expression by qRT-PCR. (B) To silence Twist1 expression, lentivirus shRNA Twist1 was transduced in TICs. Immunoblot analysis confirmed decreased TWIST1 expression in TICs and demonstrated unchanged expression of NANOG and TLR4 (n=3). (C) mRNA levels were validated by qRT-PCR. Expression profile of EMT-regulated genes, including mesenchymal markers (Twist1 and N-cad) and epithelial markers (Albumin and E-cad) were analyzed (n=3; *, P<0.05). (D) Light field microscopy demonstrated an altered morphology of TICs post Twist1 knockdown. Scrambled TICs (1) parenchymal cell phenotype drastically changed to a tadpole shape (2) post-Twist1 knockdown (40X; n=10; insets are enlarged images). In vitro oncogenicity was tested via soft agar colony formation assay. Silencing Twist1 in TICs (4) significantly reduced colony forming ability in contrast to control cells (3). The number of colonies formed were normalized and summarized (n=3; *, P<0.05). (E) shRNA knock down of Twist1 diminished the ability of TICs to effectively migrate in contrast to the scrambled shRNA control, as demonstrated by in vitro cell migration assay. The images were captured at 0 hours and 24 hours after scratching the cell layer with a 100 μl pipet tip (n=3; *, P<0.05). (F) Analyses at day 35 post TICs transplantation (subcutaneously injected into NOG mice). Twist1 silencing reduced the overall tumor volume (1) and weight (2). (3) Gross image of subcutaneous tumors. (4) Non-invasive bioluminescence imaging demonstrates the decrease in overall tumor growth (n=4 NOG mice/cohort; *, P<0.05). (5) H&E staining of xenografted tumor in NOG mice shows HCC histology. The scale bar equals 50μm.

