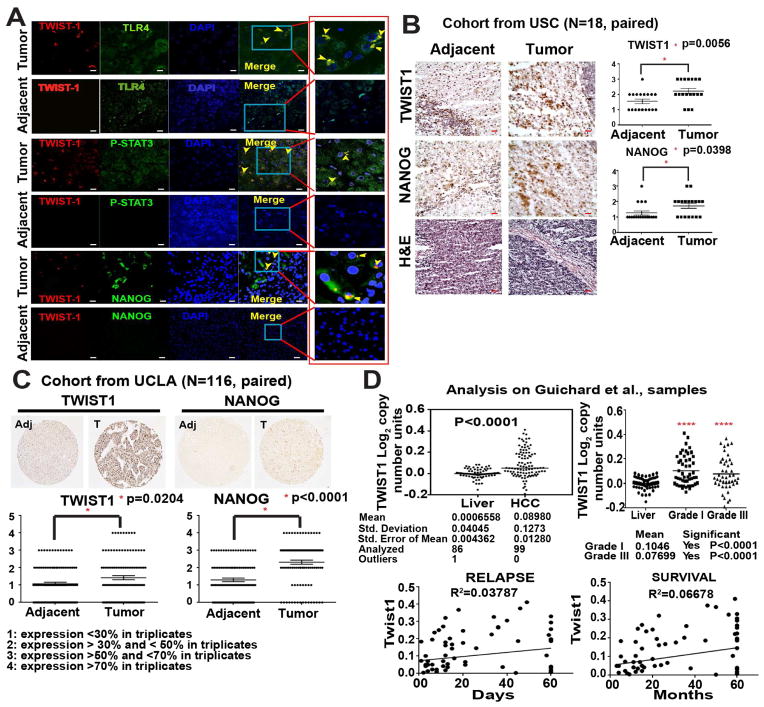
Figure 6. Accentuated TWIST1 co-localization with TLR4, P-STAT3 and NANOG in human patient samples.
(A) Confocal immunofluorescence (IF) imaging studies demonstrated TLR4, P-STAT3, and NANOG often colocalized with TWIST1 in HCC patient liver specimens (Tumor), but absent in noncancerous liver tissue (adjacent) (magnification, 40x oil; n=8 samples/cohort; n=3; Red boxed are cropped images). (B) Paired IHC staining performed at USC corroborated with IF, which demonstrated the significant increase in NANOG and TWIST1 expression in HCC tumor samples (100X magnification; n=18 samples, paired; n=3). (C) Tissue microarray analysis confirmed the correlation of TWIST1 and NANOG in a large number of patient HCC tumor samples (100X magnification; n=116 samples, paired). Adjacent = parent non-cancerous liver, Tumor = human HCC. The liver is removed in order to transplant new liver. (D) In silico analysis using Oncomine™ Gene browser, probing for Twist1 correlation with grade, survival and relapse in HCC patients via Guichard libraries. The scale bar equals 50μm.

