
Figure 5.
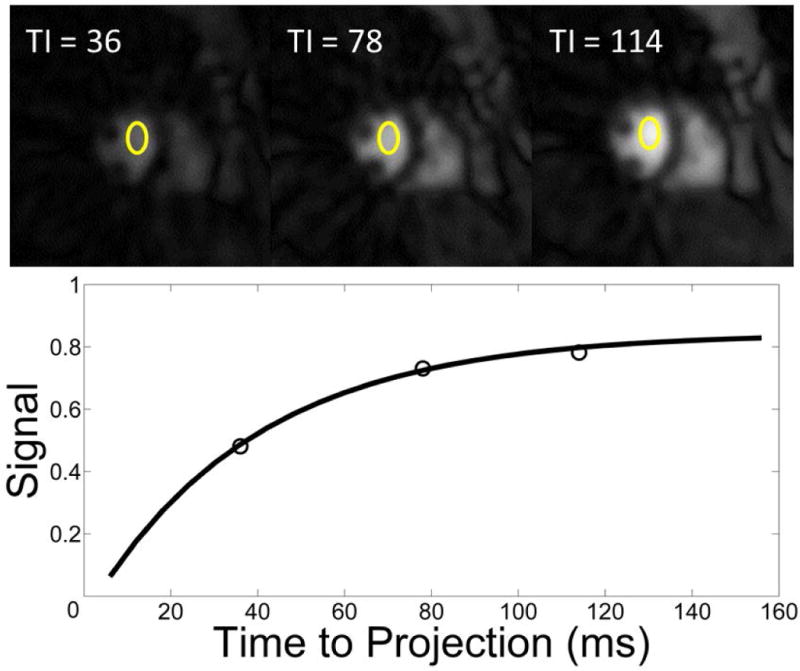
Example of the T1 estimation method used to measure the true AIF. Stated times refer to the time from the first projection to the middle projection of the image. (top) Example low resolution Images (6×6 mm2) used for T1 estimation. All images are on the same scale. Signal intensity is measured in the ROI drawn in the ventricular blood pool. A total of 13 projections are used to produce each image. (bottom) The nonlinear fit for the T1 recovery curve (Signal intensity of the ventricular blood pool vs TI).