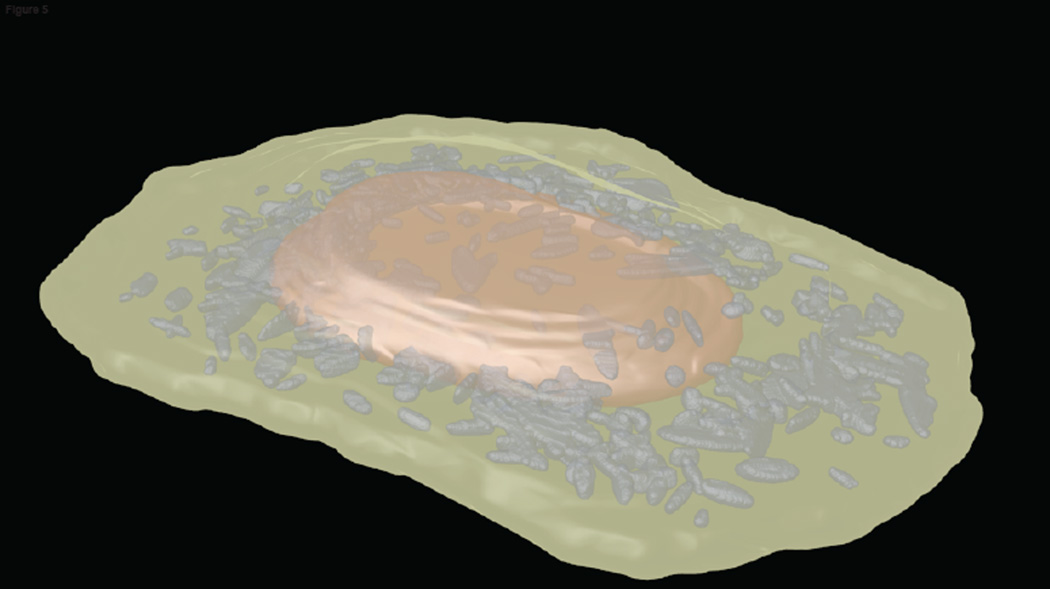
Figure 5.
Example synthetic image depicting the mitochondrial distribution in a HeLa cell. The image was produced by generating a nuclear shape from a cylindrical surface model, generating a cell shape from the nuclear shape using a ratiometric model, and choosing the number of mitochondria and their sizes from a Gaussian object model. The nuclear volume is shown in red, the cytoplasmic volume in green, and the mitochondria in gray.

