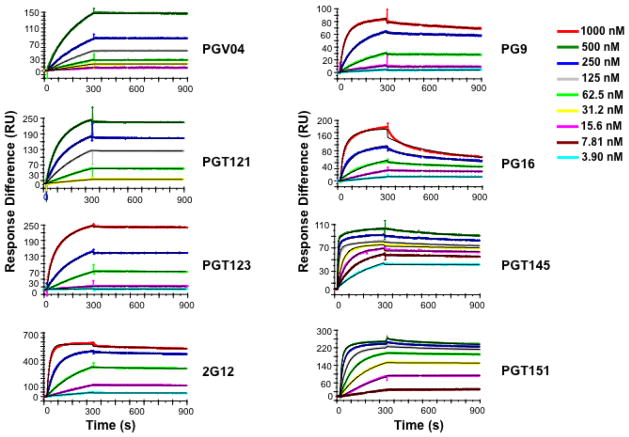
Figure 3.
The kinetics of antibody binding to immobilized trimeric HIV-1 envelope glycoprotein (Env) analyzed by SPR. The sensorgrams, i.e., response units (RU) after background subtraction as a function of time (s), show the binding curves for titrated antibodies as indicated in the legend. The same color code applies to all diagrams but the titration ranges start and end at different concentrations and also differ in the dilution steps. The data were fitted with a model for bivalent binding except in the case of the functionally monovalent antibody, 2G12, the binding of which was fitted with the simple Langmuir model. The curves generated by the modeling are depicted in black but are only visible where they diverge somewhat from the data. Note how the binding of the antibodies, all broadly neutralizing (bNAbs), differs both in on-rate (association phase, 5 min) and off-rate (dissociation phase, 10 min). The on-rate is the product of the on-rate constant, kon, and the antibody concentration; the off-rate is concentration-independent and hence its constant, koff, can be determined when the antibody concentrations are unknown, as is the case for polyconal sera. Therefore it has been possible to apply SPR and another kinetic method, biolayer interferometry, to the monitoring of increased binding strength of antibodies during affinity maturation (10, 104). The diagrams are reproduced from Yasmeen et al. 2014, Retroviology 11:41 (29).

