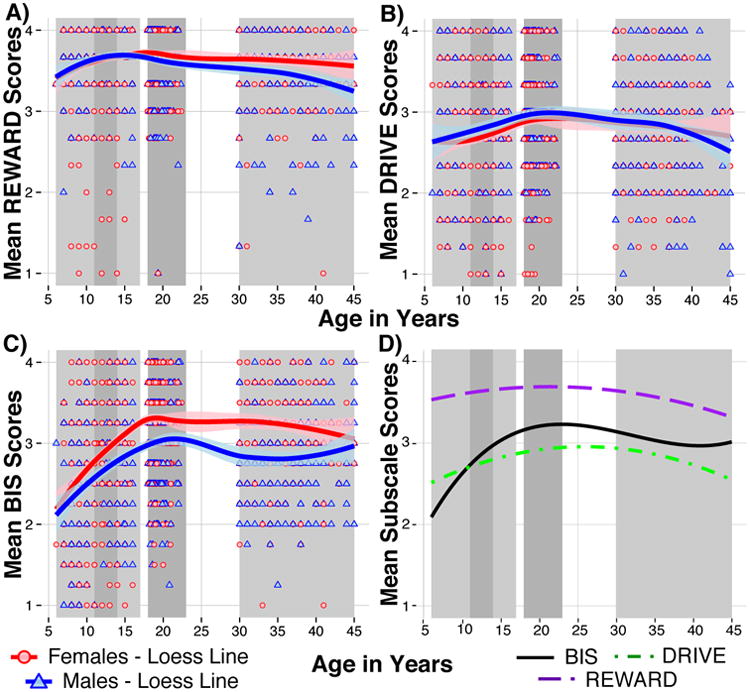
Figure 1. Revised Subscale Scores By Age and Sex.

The first three panels present scatter plots of participant age against revised subscale mean scores: (A) REWARD (RWD1, RWD2, RWD4, RWD5), (B) DRIVE (DRIVE1, DRIVE2, DRIVE3, DRIVE4), (C) BIS (BIS2, BIS3, BIS4, BIS6). Loess fit lines with 95% confidence intervals are plotted by sex for these panels. Panel (D) displays the regression fit lines for all three subscales (cubic function for BIS, quadratic function for REWARD and DRIVE). The gray shaded regions on all panels mark the age groups used in the EFA and CFA analyses (from left to right: children, early adolescents, late adolescents, young adults, adults).
