
FIG. 2.
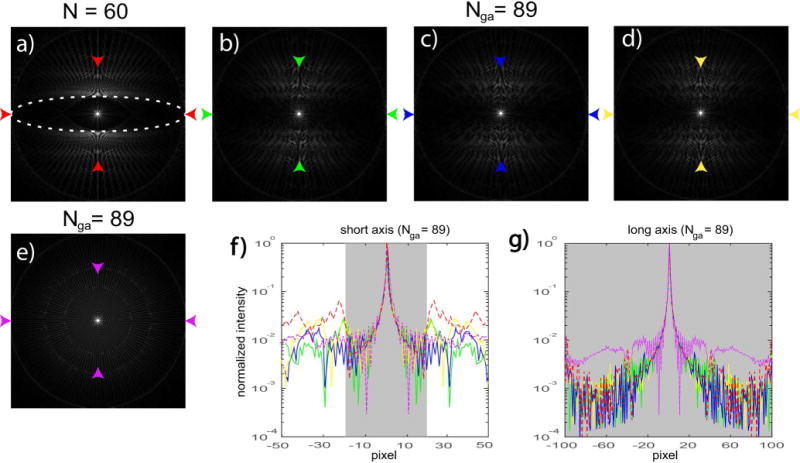
PSFs of for an elliptical FOV (X:Y = 100:20 pixels). a) fully sampled radial sampling using the Larson method (N = 60). White dash line represents the desired FOV. b)–d) 3 consecutive temporal frames using the modified GA sampling, with spoke per frame equal to the next Fibonacci number 89. e) one temporal frame using conventional GA sampling, also with 89 spokes. f)–g) plot of the major and minor axes of the PSFs between the arrows, with colors corresponding to b)–e) respectively. The fully sampled plots in a) are also shown for comparison (red dash lines). Shaded areas represent the desired FOVs.