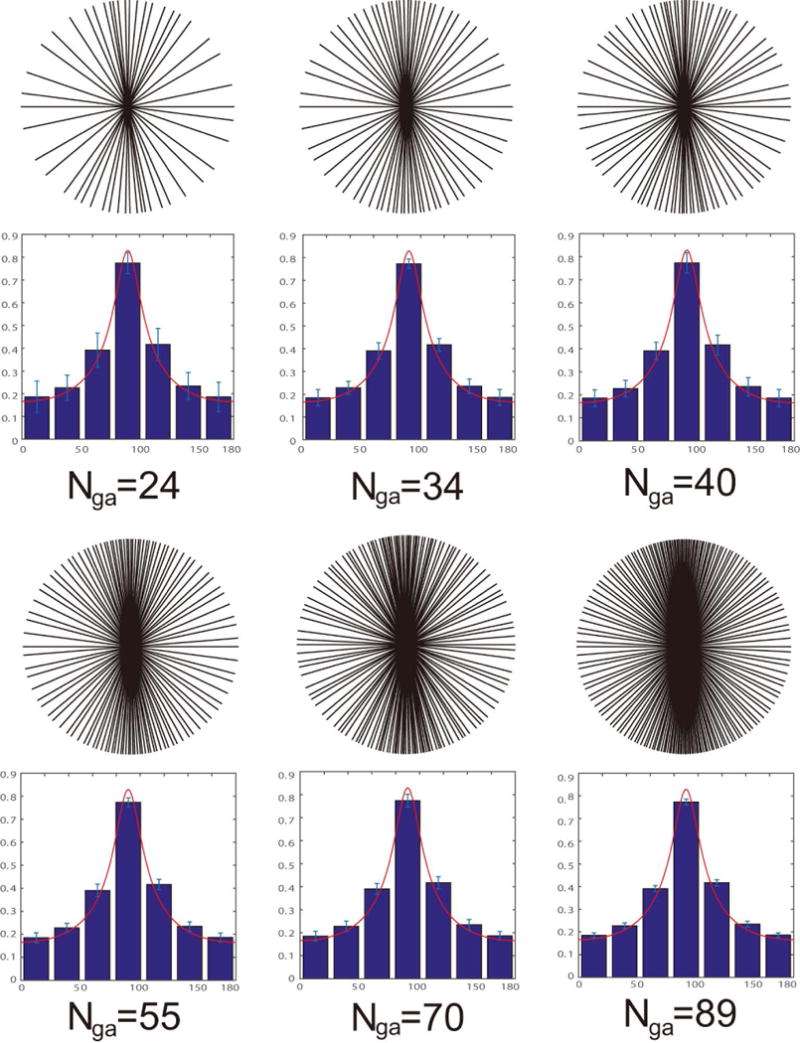
FIG. 3.

Sampling patterns using the proposed method. The same elliptical FOV ratio (100:20) in Figure 2 is used. One temporal frame is shown for each temporal width (number of spokes). The corresponding normalized spoke density histogram is averaged over 100 frames and listed below. Error bars for each bin represent plus or minus one standard deviation. The optimal spoke density distribution is also plotted (red line).
