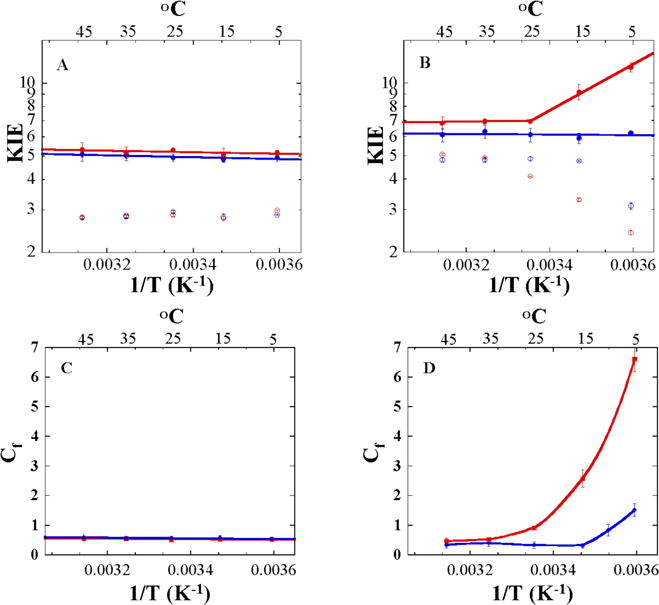
Figure 2.

Comparison of the Arrhenius plots of the KIEs and commitment factors (Cf) of native (blue) and heavy (red) DHFRs measured in competitive experiments at pH 9.0. Shown are the observed (open circles) and intrinsic (closed circles) H/T KIEs for hsDHFR (Panel A) and ecDHFR (Panel B). The lines represent the non-linear regression to the Arrhenius equation for KIEs (Eq 2). Arrhenius plot of Cf on kcat/KM for hsDHFR (Panel C) and ecDHFR (Panel D). Cf values were calculated as described in the Materials and Methods section. The lines are an interpolation of the data and do not represent an analytical fitting. Data for ecDHFR are taken from ref 27 with permission from the American Chemical Society.
