Fig. 2.
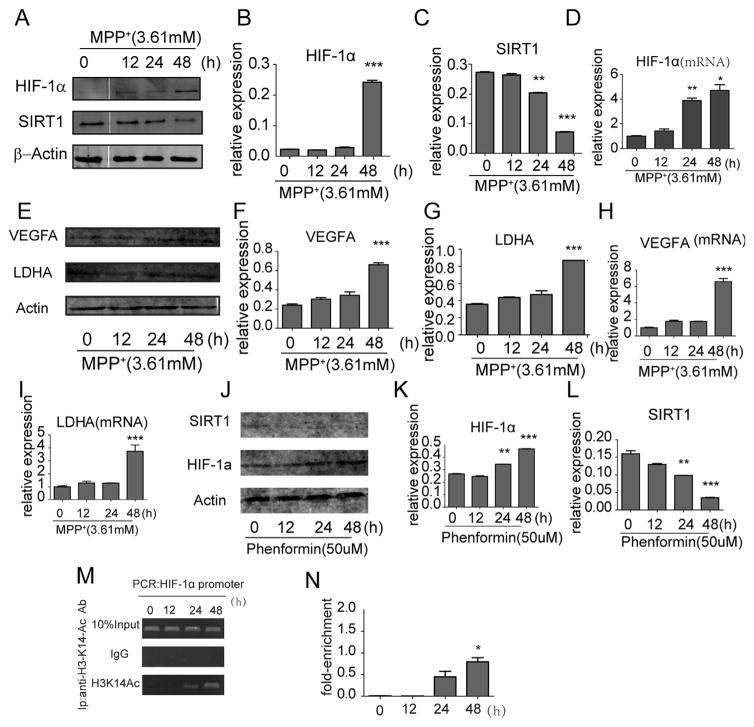
The change of SIRT1 and HIF-1 and its target genes in MPP+ and phenformine treated SH-SY5Y cells and the mechanisms behind it. Western blot assay (A) and quantification of SIRT1 (B) and HIF-1α (C) after MPP+ treatment. (D) qRT-PCR analysis of HIF-1α expression in SH-SY5Y cells after MPP+ treatment at different time points. (E) Western blot assay and quantification of VEGFA (F) and LDHA (G) after MPP+ treatment. qRT-PCR analysis of expression of VEGFA (H) and LDHA (I) in MPP+ treated cells. (J) Western blot assay and quantification of SIRT1 (K) and HIF-1α (L) in phenformin treated cells. (M) A specific H3K14-ac antibody was applied to detect the H3K14-ac level at different times (N). *P < 0.05, ** P < 0.01, ***P < 0.001, compared to 0 h. Data were expressed as mean ± standard error.

